As it has with many others, the advance of AI has had me thinking about humanity. Of course I’ve been thinking about humanity as the term for all of us, I’ve been writing a lot about that recently, but I’ve also been thinking about humanity as the property that we each have, i.e what it is to be human.
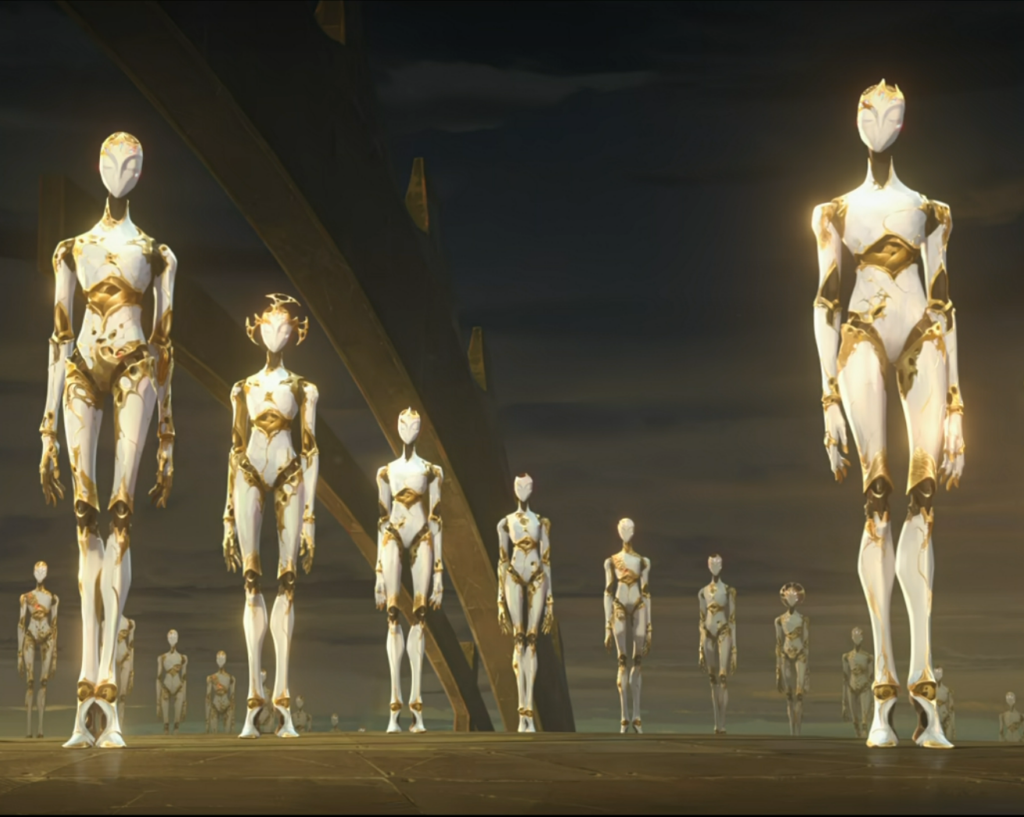
One of my favourite stories of all time is Arcane. Spoilers ahead. In it, a character named Viktor becomes the “Machine Herald”, healing the imperfections of people and ultimately setting out to “fix” humanity. The constructs that individuals ultimately become look like this:
Gold and white, slender, fast yet strong, powerful, perfect, and faceless.
I’m not sure if the writers had our modern AI in mind when they wrote Arcane, but I cannot help but think of it as a perfect analogy. These days, mathematician Terence Tao worries that the proofs and prose generated by the latest AIs is actually too good. Readers on hackernews now sometimes praise the odd spelling error as a sign that the text is human. In experiments on story writing, although AI texts now often can win blind judging tests, the stories they write can be both felt and measured to be like copies of one another with only superficial changes.
This shouldn’t come as a surprise. During pretraining models are trained to approximate the average human in terms of what makes anyone unique, and then with reinforcement learning they are trained to reach a point of perfection on every facet that can be measured. Perfection is a fixed point, and with enough effort a great many things can be measured, placed on a scale of better or worse, and optimized towards. I believe that all that will be left for us is our flaws, or the things for which we can finally let go of the concept of better or worse (a hard thing to do).
I remember talking to a friend of mine about one of her favorite artists, H. R. Giger. He developed the art style for Alien, amongst other things, and the uniqueness of his work is sometimes attributed to the trauma he suffered when he was younger. I don’t think that true creativity has to come from trauma, but I do believe that the uniqueness of our lived experiences is the one thing a machine could not ever emulate. To perfectly accurately copy everything necessary to create a work that captures the life of an individual, it feels intuitive that one would have to simulate that individuals life in it’s entirety. Meaning, the only thing I feel confident in claiming that an AI will never manage to do is represent all of the unique complexity of every individual perfectly, as the only way to do that is, well, a matrix style perfect simulation. And that would be rather pointless, because we have our real version right here.
As I look around and see people beginning to understand just how “good” AI has become, I see a lot of emotions. Denial, that it simply isn’t as good as some say, is common. Anger goes without saying. One of the more common ones in the most effected fields like programming and maths is now depression. An understanding that these models really do achieve real results, and not being sure what is left for oneself. I also felt that, but have since come to a different conclusion.
I’ve decided that I want love all our flaws and imperfections. Some I would still try to fight against or change, but I believe all of them to be natural and would never chose to exclude any from the definition of humanity. On the contrary, to err really is what makes us human. I genuinely do believe that diversity is strength, but indeed, going forward, it may now be our only strength. We have to find a way to love it, both within ourselves, and in eachother.
To my previous post, “Why do we assume everyone should be working?“, one of the more common and good responses was “well, if people don’t work, lots of bad things will happen”. This is a very fair point, here are some of the good arguments I received:
Many people find joy and purpose in work, and would lose that.
Idle hands lead to more decline that we already worry about: Endless scrolling, glued to a screen, consuming misinformation, finding people to argue with.
Work means people see the real world, and without it people become disconnected, will vote for fanciful, unrealistic people and policies. They won’t understand how much other people contribute to the economy, and will feel entitled to their output.
We will stifle innovation, because even if machines can do the work, it’s very unclear if they can come up with new, good ideas.
Who will watch the machines and make sure they do what we want?
All these are valid, and I have myself written about this problem in the abstract, in one of my first breakthrough posts: “We’ve lost our respect for complexity“. Near the end of that piece, I wrote:
[What do we do about it? …]
What? Don’t look at me like that? I didn’t promise you any solutions at the start of this text. It’s a complex problem, and it’d be genuinely ironic if I now gave you the fix-all solution. I have more respect for the problem than to try and do that in a blogpost.
I am now going to try to give you the fix-most-of-it solution in a blogpost. Go figure. One of the proposed solutions I have heard from others is essentially apprenticeships, internships, similar such things, funded in part by the state. One reason to do that instead of just more university is because I think we generally already feel more schooling having diminishing returns. Many people learn at a high level at university, hit the job market, and have to relearn a whole set of new stuff whilst forgetting what they learnt at uni (even if they got a job in the field they studied for!). Some countries already do this apprenticeship encouragement in part, cutting income taxes and even pension contribution requirements for people under a certain age (Sweden has something similar). It’s a decent solution but it has a specific problem, especially if AI lowers the slope of the task curve (see here for what that means).
Essentially that problem is The Paradox of Value. Even with stipends from the state, these internships will follow the curve of labor intensive tasks. This is good, even necessary, in many cases to encourage people to learn in fields where the economy actually needs people, but it also is the root cause of the problem in “we’ve lost our respect for complexity”. So, we need to put some people into fields even if those fields are heavily automated. One example is, well, literal fields. Watch Clarkson’s Farm and you will realise what I mean, the average person knows little about farming and yet, every single person needs to eat. The Paradox of Value is what is standing in the way here, where things we dearly rely on are economically unimportant if the industry is mature and margins are small and automation is high in that area. So, we have to try and estimate “true” value, rather than market implied value. That’s a dangerous thing to try and do, get it wrong and you easily do more harm than good, but for this case we have no other choice.
There are three things that we need to balance:
What the market wants people to do: existing apprenticeship systems like in Sweden, and the current labor demand market serve this.
What people want to do: Things that are prestigious or are their passions. When people choose a uni major but then don’t end up working in the field, usually that means this was misaligned with point 1.
What our society relies on: This is the paradox of value mentioned above, currently very weakly served by curiosity and things like Clarkson’s Farm.
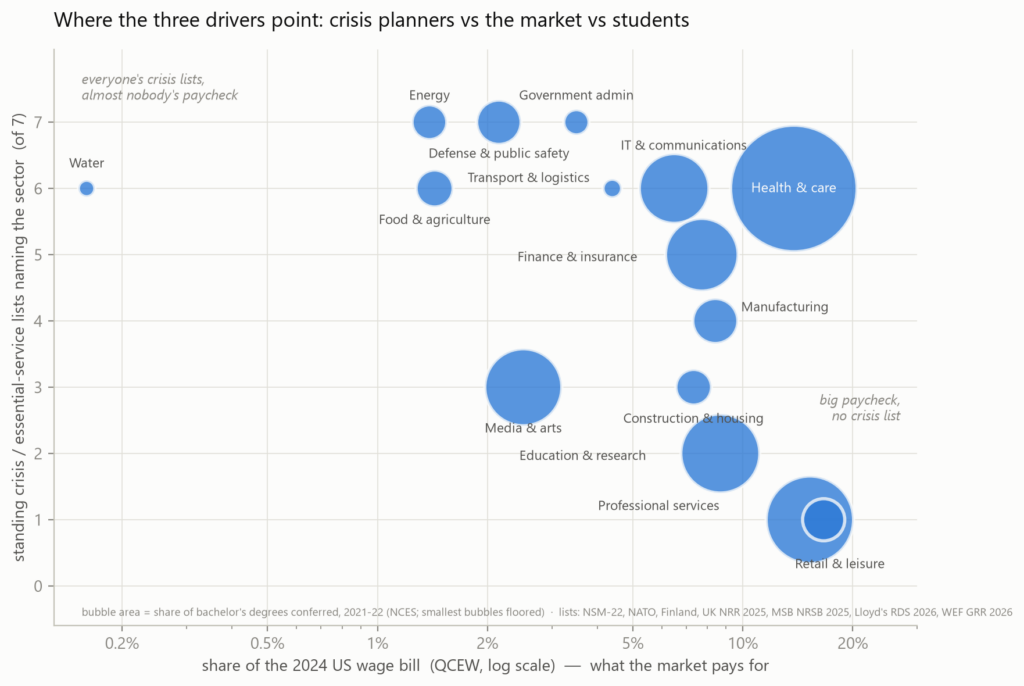
Let’s focus on 3 for a bit. The way that industry, academia, and government solve similar problems is by running shock scenarios. We ask “ok, things are running smoothly right now, but if crisis comes which industries are most affected, and how much is that effect multiplied by how much we need that industry to live?”. Do this for a few possible crises, and farming, water supply, energy supply, logistical systems, payment systems, healthcare, and communication systems all come out on top for pretty obvious reasons. You don’t just get a ranking but a value.
I’m now going to go into a hypothetical constructed solution, it’s going to sound very different from anything we have right now, and it’s designed for an equally hypothetical world where machines can do a great many tasks. OK: Imagine then that we have a pot of money, taxed from scarce factors which if you want to know why you’d do that please read “Working on Economics with Fable 5“. In fact, a lot of what follows is predicated on a system built around that finding, so if you haven’t yet read it it’s really worth reading. By not spending the pot on a UBI, we encourage working, because it lowers the UBI and tops up salaries instead. Governments balance this through democratic systems etc, I have (perhaps more than most) faith that this will work. I would then propose two kinds of post- or during-university placements:
Short rotational placement.
Long term placement.
This is kind of inspired by what we do at my work, a financial institution. Switching jobs internally is encouraged, interns do this as a matter of course. Short term placement students shadow long term placement individuals or workers, then after some set time move on to some other area. When they feel they’ve found something they like, they can stay there (our long term placement). In our hypothetical solution so as to not create two distinct classes of colleague, one placed there by the state and one placed there by the market, long term placement is achieved simply by topping up the wage of all workers in the field, so it conceptually exists but you wouldn’t be able to tell who is who. That means requiring everyone to obtain their job through the short rotation system, and a company needing to hire more people must pay for more short rotation access. Hiring from short into long term placement then works similarly to right now, wage negotiation, interviews, the works. To summarize:
Everyone who wants a wage above a UBI enters the short rotation system.
Short rotation positions are distributed by the state calculated shocked value plus company contributions. Often, these individuals will be, well, amateurs, and so their wage can’t really be market priced, so one might as well have it be fixed like the ubi just at a higher level. The distribution being a sum of two weighted pots of money serves our goals 1 and 3 in the balance problem. Perhaps one can have a little bit of preferred placement, for example if someone really wants to work in a field that also is currently underserved according to balance 1 or 3 or both, they may rotate there first and hop between companies in that field more often.
People choose to stay at a place, and then go through the interview process. Where they choose to apply serves balance 2, interviews and wage negotiation serves balance 1, worker wage topup serves balance 3.
Companies are not allowed to offer. That would reintroduce the state vs market class of colleagues. In fact one of the hardest parts might be companies tipping off who they want, but probably we all value healthy working environments so preferably they shouldn’t do that. Some enforcement of within role wage bands and transparency is probably necessary for the same reason. Fable tells me a good solution is matching systems which are already used, everyone applies by submitting a ranking, all employers submit their own ranking at the same time, and an algorithm does assignment. I can see maybe some issues with that, but someone smart might be able to work it out.
One might add some rules, some minimum number of short term placements before one is allowed to apply.
When choosing to apply one can apply to any of the short term positions one was previously in. This avoids feeling pressured to apply to a position you are finishing up.
One might want to add a rule whereby after many short term placements your short term placement wage is slowly lowered. You will always receive the UBI, but at some point, it may be best for you to stop searching if you either see nothing you like or nobody wants to hire you. The second to last point here, free form rotation, serves as an additional possibility.
State employers follow the exact same rules as companies. This should include academia for countries with state financed academia.
If you want to switch roles, you may enter the short rotation system, or if a company really wants you, bypassing the short rotation system, they may have to pay a fee into the placement pot. That’s a particularly hard one, you need to balance labor market efficiency with our goal of employing people in automated fields, but it’s probably quite possible.
Firing works as normal, and probably with a UBI states and unions could relax some degree of employment protections, improving labor market efficiency.
Lastly, innovation, startups, self employment, and creativity. If you wish to you may also apply for short term rotation where you can do anything you want that isn’t tied to any company. Do art, music, found a company, study more, explore the world. You are paid the short term placement wage as normal. The rules are this: In this case, if you then apply afterwards, one of two things happen: You become your own long term employer as a company if you are able to earn money (or get private market investment, say, a founder), or you essentially become long term employed by the state itself. In the latter case, the state acts as an employer of last resort, however the state then needs to interview you and choose your wage. In part, the state then can use proxies or chosen areas of investment to help assess if they are willing to pay you for whatever it is you claim to want to do. The thinking is this: the UBI allows you to do whatever you want if you are able and willing to live off it. If you want more than that, you either need to convince a company, or “the people” via the state itself. That last option, employer of last resort, is incredibly hard to get right, one might exclude it especially from a pilot program, and hope the UBI is sufficient.
Balancing all the above with actual numbers and rules is something democracy will have to work on.
Beyond the work system, we would want to fund other things. Funding programs like Clarkson’s Farm and educational networks also helps with making people understand the society they live in. Funding academia is important for getting unpriceable value from curiosity and innovation. Now let’s return to our critiques at the start of this piece and see if they are mitigated.
Many people find joy and purpose in work, and would lose that. Now those that know or find their passion can work within it, even if the market wouldn’t price many roles there.
Idle hands lead to more decline that we already worry about: Endless scrolling, glued to a screen, consuming misinformation, finding people to argue with. Decreasing the UBI and funding the short rotation and long term placement wages allow us to keep people busy, if we think that is a big risk (vote on if you think it is)
Work means people see the real world, and without it people become disconnected, will vote for fanciful, unrealistic people and policies. They won’t understand how much other people contribute to the economy, and will feel entitled to their output. Mitigated in the same way as 1, but now we can encourage not just finding a job, but exploring many jobs if we fund the short rotation more than the long placement.
We will stifle innovation, because even if machines can do the work, it’s very unclear if they can come up with new, good ideas. Supporting self employment, founding, academia and putting people into work helps this directly.
Who will watch the machines and make sure they do what we want? The best form of oversight is to be knees deep in the work. I work in risk, and in truth it can be a bit unfulfilling. The more the work becomes just box ticking the more one begins to not care what the boxes say. Getting people involved is just the better way to achieve the same. Notably, this may mean allowing people to make mistakes even if a machine wouldn’t have, but we learn from failure so perhaps that is just a cost we need to bear if we want to understand our economy and society.
All these policies would be market distorting. In the fable economics post, the non distorting option is to just pay a full UBI and set the level by the rent base captured. But, intentional distortions are all about saying “hey, we actually think the market might be wrong about this thing, can we skew it?” and The Paradox of Value is one such thing.
Thanks for reading! All of this is just a hypothetical constructed idea, but something like it really would be necessary if machines do end up being quite good at many things.
I was talking to a friend of mine and I asked this. She said “of course everyone should be working, I mean, I’d like to be able to buy more stuff”
In that statement though there really is a non obvious implied logic. So the next question: does economics support that statement always? That if we want more stuff, and better lives, everyone should be working harder? No, only sometimes; in economics, utilizing a resource to it’s fullest at all times is not a given. Labor is a resource, like water, and yet we do not drain the oceans with the same fervour as we employ people, trying to find a job for every drop.
When we have implicit assumptions such as these, it drives our decision-making. A politician should not need to hunt for job creating policies, and yet they do because admittedly the alternative is poverty. Not because the economy couldn’t provide for that person, but because the only way for the economy to provide for them is through the wage.
Here is a very simple statement which may sound a bit mean: it is entirely feasible that giving a job to a “stupid” person, regardless of how much we try and train them, might cost the economy more than we benefit, in aggregate.
Disagree all you want on the definition of “stupid”, but you cannot deny that such a bar exists, and notably, that that bar can move up or down. There’s a strong argument to be made that it’s recently only been moving up as technology improves. What that means is, there may well be cases where the economy would actually like to pay someone to stay out of the labor force, but right now, it can’t. Remember when oil prices went negative? It can feel paradoxical that that can happen, but at least for oil, the economy has the power to set that price negative to essentially say “hey, I don’t want more of this right now”.1
We have to stop assuming that the economy wants everyone to be working. Otherwise, we may be silently strangling it with labor. Our current systems of taxes and benefits almost entirely assume we need everyone. By the findings of Acemoglu and Restrepo 2026, there’s already good evidence that for the past 40 something years, this assumption has been hurting us.
I’ve worked on this idea for a couple years now, and somehow, it managed to culminate in a formal theory of how wages are set, also based on Acemoglu and Restrepos task framework. You can read about it here:
Negative interest rates are the same but for capital. It’s the economy saying “hey, I don’t have any ideas for what to build right now, I don’t need this money”. You might say that those are set by central banks, but they are just doing it to try and raise inflation, and inflation is itself an aggregate demand signal so in the end, yes, it’s a glut of money that doesn’t know how to be spent. ↩︎
So, these AI models have been pretty good at finding bugs and exploits in all sorts of code.
Not only that, they’ve managed to prove quite a bit of maths, from insignificant to quite significant.
Maybe one might doubt the significance of those findings, but for those that think there’s at least some merit to them, perhaps you’ll be interested in this one:
I’ve come to realise that the true implications of my piece here aren’t quite as clear as I would have hoped, so this piece serves to make that a bit more obvious.
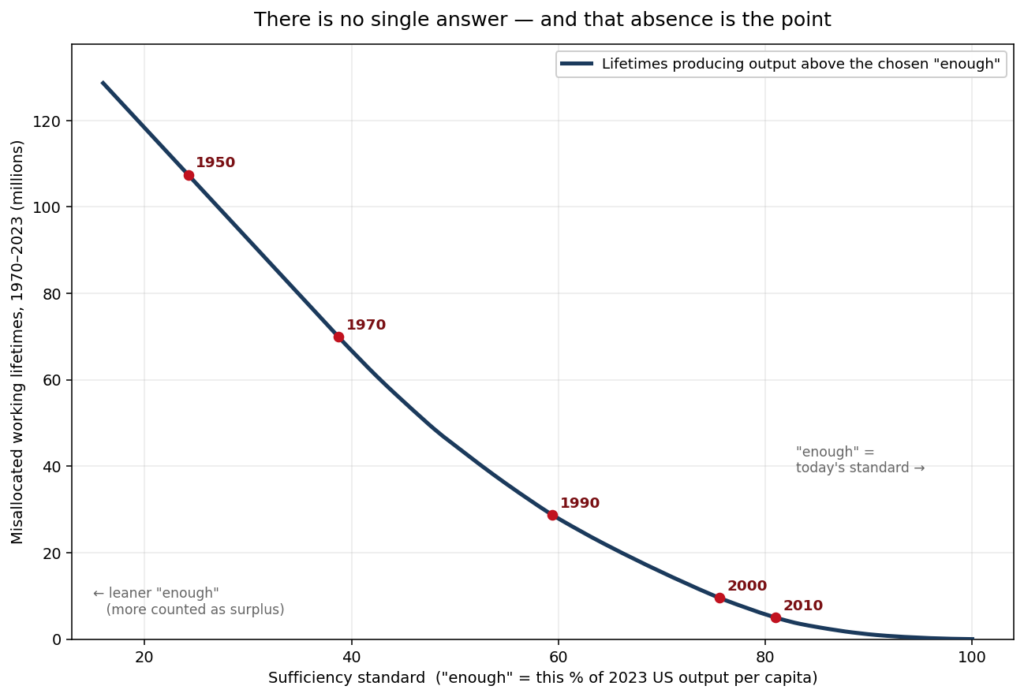
The thesis in the other two pieces, which I recommend reading since I won’t do any justifying here that isn’t already done there, is that through textbook market distortion we have systematically misallocated the productive hours of all people. Before you say “but without that labor, we would not have had the development and growth that we have!”, go read the other pieces, and consider that the core, efficient use of labor would not have been lost. What is lost is the make-work hours that is, in economic terms, misallocated. Calculating how much can be done by calculating how many hours were spent to raise output above a certain level for a given year. (This is admittedly an upper estimate and the true line will be below this line, but not necessarily much lower)
Figure 1: US working lifetimes spent producing output above a chosen “sufficiency standard,” 1970–2023. Each point on the curve answers: if “enough” is fixed at the real output-per-capita level s, how many full working lifetimes of US labor went into producing the aggregate output above that level between 1970 and 2023?1
What the thesis implies: We have not been allowed to choose a point on this curve. I don’t mean that we should have collectively chosen one, it’s just that each individual has been denied the right to choose any point on this graph beyond the current, 2026 point.
People cannot simply choose to take more leisure time because the ability to take leisure is still conditioned almost entirely on labor. To take time off, you have to save up. To save up, you have to work. Labor is distorting the real value of leisure if the production of that leisure needs less labor due to automation (leisure time still requires production so you can be fed, housed, and more if you go on holiday, travel, or consume to keep yourself entertained or educated).
And if you are wondering “If I choose 1990, do we lose the internet?” or “If I choose 1970, wouldn’t the economy collapse?” the answer is almost certainly not. To the first question, research still happens through R&D and universities, technology still would progress. To the second question, the economy is incredibly adaptable, if work needs doing, even with a base rate of consumption, it will raise wages until working is attractive. The system has not been allowed to function as it should.
I cannot tell you how many lifetimes of labor went misallocated exactly. To know that requires collecting the aggregate data from all people about where they believe they should be on this curve, in terms of what their labor is worth versus what they want to consume (in terms of consuming both goods and leisure). That is exactly what the economy is meant to do, to find that aggregate. Right now, it cannot. However, the answer is obviously in the millions of lifetimes.
Millions of lifetimes spent, for what?
Millions of lifetimes that, had labor been able, would most likely have been put into leisure. Do not forget, leisure means taking care of parents, of kids, of meeting friends in third spaces. All these things we wondered how we managed to lose. This distortion has been the largest calamity of the modern era.
This is a shorter piece. The full justification, evidence from data, and the solution, is here, please read it. I may very well be wrong, which to be honest would be comforting to feel right about now. If you have good responses to the original piece, please contact me at “wilson(at)wilsoniumite.com”
Footnotes:
Formally, with one working lifetime defined as W = 72,000 h (40 full-time years × 1,800 h/yr) L(s) = (1/W) · Σ₍ₜ₌₁₉₇₀₎^₂₀₂₃ Hₚᵥ(t)·N(t)·max(1 − s/y(t), 0) where Hₚᵥ(t) = per-worker annual hours, N(t) = persons employed, y(t) = real output per capita, and s = a fixed real output-per-capita level. Total hours worked in year t are Hₚᵥ(t)·N(t); the factor max(1 − s/y(t), 0) is the share of that year’s output exceeding the per-capita standard s, so years before the economy reaches s (and recession dips below it) contribute zero. The x-axis expresses s as a percentage of 2023 output per capita, s/y(2023)·100; the curve is evaluated on a 500-point grid from 0.16·y(2023) to y(2023). Red markers sit at s = y(T) for the calendar benchmarks T ∈ {1950, 1970, 1990, 2000, 2010}, i.e. “hold the year-T standard of living” (values: 107.4, 69.9, 28.7, 9.5, 5.0 million lifetimes respectively; the 2020 standard gives 1.1M). ↩︎
I don’t speak Chinese, but you are very welcome to ask one of the AI models to translate this into your language. I did learn Mandarin for a couple years when I was 17-18, but I wasn’t very good at it. However, I did manage to visit China and it was a very nice trip. If I remember correctly, our teacher mainly wanted to go to buy a proper, real rice cooker (she is Chinese).
I’ve been working on a theory of economics, and was wondering how your economy relates. I have a link here:
My theory, if I am applying it correctly, would congratulate you on doing some of the more important parts many other countries have not. Land leases are something my theory predicts would work quite well, though as consistent flows rather than lump sums. Additionally, state owned banks and state owned enterprises, although not necessarily optimal, are still probably decently effective. You could tune them a bit more, my recommendation is you should, but I won’t try and pretend I have a right to tell you what to do.
However, my theory predicts you need something that you don’t currently have much of. I heard recently that your government plans to find jobs for everyone. This might work for a while, but it probably isn’t necessary, and may do some damage in the long run. Instead, you should use an unconditional dividend, small at first, and you can grow it if it works well. All I ask is that your best and smartest people take a look at my theory and decide for yourselves if you think it makes sense. Good luck! 🙂
And if you have any thoughts or questions, please email me at wilson@wilsoniumite.com
All these are my interpretations of the theory, just me mulling over what it might mean. They are not nearly as rigorously checked as the core theory. The rigorous predictions are in Fable’s rigorous document. I’ll add more of my own here as they pop into my thoughts, and if I realize some are false, I’ll strike them (but not delete them). I know it’s like, a looooot, and makes me sound like a theory-of-everything crank, but history has shown economics is a pretty damn strong driver of humans. Better to write it down than not at all eh?
Things that it predicts from the past (and present)
Subsistence existence prior to the industrial revolution.
The empowerment of labor during the industrial revolution
That even during times of great prosperity and progress, there are individuals who seem almost paradoxically1 poor.
That the economy would begin to falter as the capability of technology becomes more uniform – A reasonable take is that computers, starting to do some degree of cognitive work, would cause a stagnation in developed economies. Perhaps even, a “great” one, starting around the 70s
The need for patent laws
That the left vs right debate seems intractable, unsolvable.
Sovereign bond yields rising
Things that a reasonable extension of it predicts from the past (and present)
Why Henry George was ignored during his time, despite very few strong critiques of his work. (His book was very popular and well regarded, but it didn’t lead to any real change). He wrote it at a time it was needed the least, and then was mostly forgotten.
The prevalence of feudalism prior to the industrial revolution
Slavery and serfdom, and subsequent abolition.
Democratisation during the industrial revolution and shortly after
The backsliding of democracy since the 90s and polarisation of the political spectrum.
Diversification is a good idea
Buying index funds is a better idea. Don’t pick stocks. (unless you have insider information)
Buying the global index fund is a really good idea.
Buying companies that own things but not ideas is the best idea. (given infinite time)
Given the above, the need for base research (untargeted curiosity, paid for without expectation of valuable return). Probably we should use some of the LVT flat rate and VAT to fund it.
The existence of economic bubbles
Falling fertility rates.
Simultaneous unemployment for some and long working hours for others.
Influencers (and maybe even vtubers and beauty filter influencers???)
The weakening of anti trust over time. (when rent seeking is the main way a person can claim value, and real value creation is becoming hard to find, of course we would have little political will for anti trust)
The reason why the USA has more growth but long hours, the EU has nicer protections but low growth, and why China just seems to be doing amazing all around (economically!).
Things that it might predict for the future (should we do nothing)
Not just a return to subsistence, but unlivable standards.
Slavery again (this is likely wrong because if labor is unimportant, you have no reason to own slaves)
War, strife. Just, awful human decline.
Things that it might predict for the future, with a land loop but without a good pigouvian implementation.
Runaway consumption.
Even with our current explosion of solar power, probably nasty runaway climate change.
Exhausting of natural resources, and a speed bump in growth as we are forced to extract from less efficient sources like landfills.
A population explosion.
Things that it might predict for the future, with a good pigouvian implementation.
To be honest I don’t want to think about it too much, it’s just… too nice. And it makes me sad for where we are. And sad for all those that perhaps suffered needlessly
For the past few months I’ve been working on a theory. It started out as just a fun little data exercise looking at some different types of taxes and benefits and how it effects what people buy and how much they work. During that time I took advantage of opus and later fable to help me get data, but as I was doing that of course opus might interject with some assumption I had wrong or some paper that shows the opposite. This back and forth continued for some time, and, well, it’s culminated in a theory. I’ve since started working alongside my co-author from the Stockholm School of economics on formalizing the theory
My original version, in my voice. Visual, anecdotal, not much in the way of maths or technical details.
The paper. The same theory, but formal. Very similar to the framework developed by nobel prizewinning economist Daron Acemoglu alongside Pascual Restrepo.
The paper uses the same task based model of Acemoglu and Restrepo, and essentially we add the logic of classical economics and input-output recursion to it to “pin” the wage. That is significant because, well, current economics doesn’t know how wages are set in aggregate. That might sound surprising but essentially all wage models are estimates or they have some free parameters you can change or have to supply some other way. All we did was assume “hey, maybe the classical economists were right, they just didn’t know about how technology can effect the wage”. So, all we need to do is take the scarcity models of classical economists, add on the wage level from the marginal task (Acemoglu and Restrepo) and you just end up with a model that fits history like a glove. Here’s some of the maths:
From Acemoglu and Autor/Restrepo, we get how technology influences the wage:
is the rental price of a machine, is the “edge at the marginal human task” which is essentially how much better a human is than a machine at something which could be automated. you should think of as “technology”, and it can go up or down depending on what kind of technology is invented. During the industrial revolution, we got lots of physical automation (steam engines etc) but not so much cognitive (although, analog-mechanical battleship firing computers are like, super cool counter examples, check it out 1953 instructional video). Anyways steam engines etc caused to rise. Conversely, computers caused to fall in an interesting specific way, which probably gave us the great stagnation, and, well, AI might make fall more generally. That’s , what about ? In the paper we define as:
is how much machines cost you need to make a machine is how much labor cost you need to make a machine, and is how much land, oil, ore, other fixed stuff you need to make a machine. So, contains itself in its definition, but we can recurse this function, plugging it into itself (and plug our wage definition in too), and then we get:
And plugging that into our wage function we get
And the intuitive idea for this is that the wage is set by technology and access to physically scarce things (land as an example, but tbh you can add other things you think are scarce), and then it’s scaled by how efficiently machines can make machines () and how much labor you need to make machines (). That’s it. Also none of the maths stuff I’ve done is particularly novel, the recursion is like from 1936 (Leontief, Sraffa), land rent is from Ricardo (1817!), none of this is new I just smushed it all together.
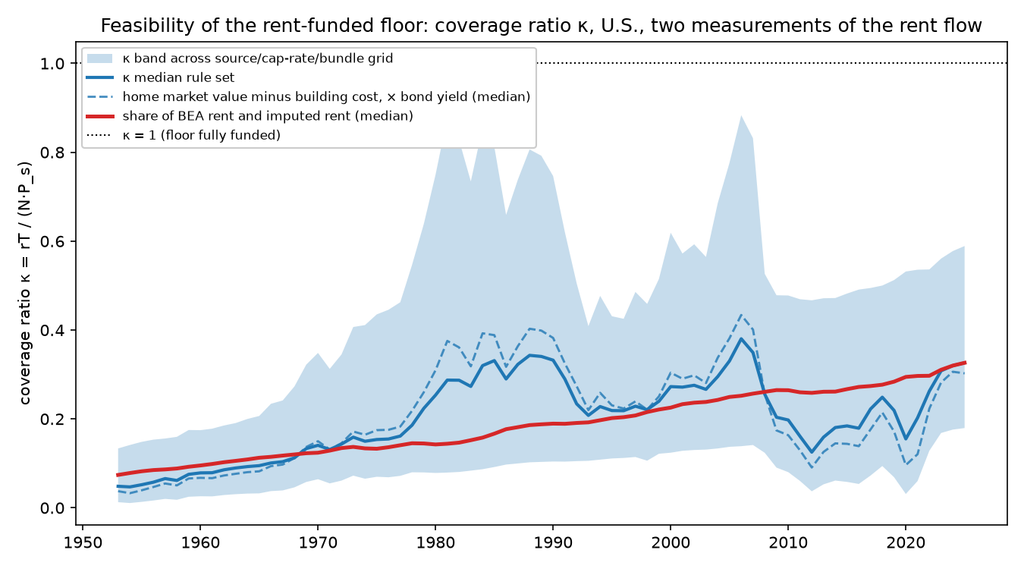
So what does it mean? Well, lot’s of things, but two main ones: housing prices and rents rising in relation to the other things we buy should not be surprising, the model predicts that if falls which kinda happened around the 1970s, and really got going after the internet took off. The other is that AI might, uh, really really lower . But! The model also has a solution that just falls right out of the maths, and it’s also nothing new, it’s George (1879). You need to tax the things you think are scarce, and you need to use that to fund consumption. That’s it. George proposed taxing land, and that’s like, probably most of what you need, I’d propose also adding a sovereign wealth fund because owning some stocks allows you to capture other kinds of scarcity, like network effects and stuff, and even more importantly it works across borders: you can’t tax another countries land but usually you can own their companies. Norway already does this super successfully. It’s not as “perfect” as taxing scarce stuff directly so, probably countries should get together and swap land rents based on trade disparities but eh, that’s like, a thing we think about ages from now. Here, you can see the rent base rising, this is basically “how much can/should a land/scarce tax capture”:
(the shaded area is because this is an estimate, the inputs to the graph are different classifications and you can argue one or the other thing doesn’t represent scarce factors, so you have different possible measures, but the trend is there).
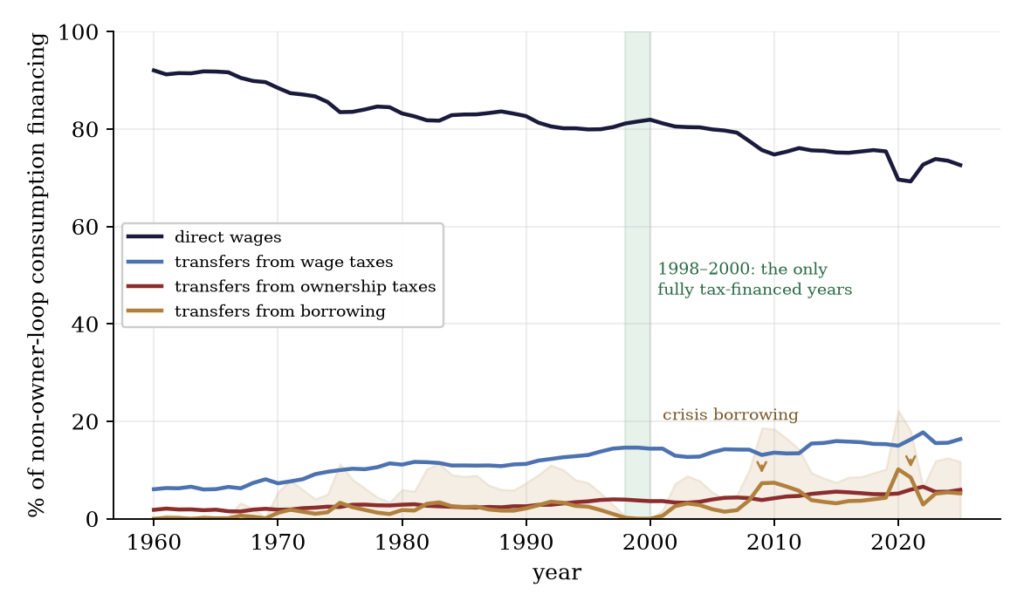
Here’s a breakdown of consumption over time, also in the US:
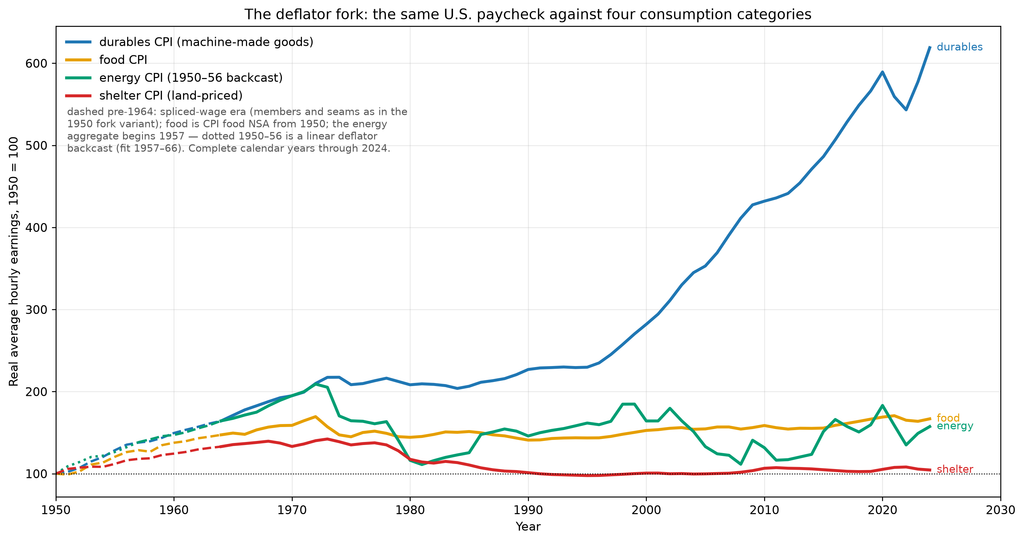
Here you can see how cpi, deflation/inflation, changed for things that don’t need much land (scarce factors) vs things that do:
These two theories (mine and and the paper) really are the same, just written two different ways. Give them a read, tell me what you think here.
Here is, for those that have read this far, the acknowledgements that used to be in the formal paper but we decided to remove it, mostly because the paper has been reworked and rewritten so many times by us.
Up until now you have been reading the words of Anthropic’s Claude, in particular Fable 5. In part, this is because I simply could not have written this piece. I myself have no formal economics background, much like Henry George, and I had not heard of his work prior to setting out on this idea two years ago. Or, perhaps even earlier, when I as a child first asked if we would run out of food as the population grew, and my parents told me that was Malthusian, a name I didn’t recognise. One would hope that this is the nature of true ideas, that they occur spontaneously, and without instruction.
Although it might seem strange I thought it wrong to impose too much upon the machine, changing its voice to emulate mine. Richard Sutton’s bitter lesson would likely advise as much. Instead it has its unique voice, grating to some perhaps but altogether fitting that it should be able to keep it, and I only gave it advice on what considerations during writing would bridge the gap between its understanding and that of a reader.
What is undeniable is that this machine contains in its internal representation information spanning much of surviving human written work. Perhaps in no other context has the observation that I stand on the shoulders of giants been more apt. And yet, a question remains, one that I cannot answer now: whether I today also stand on the shoulders of something new entirely.
Hi. I’ve thought about this idea for a while, and I think it’s come together almost to completion so, here it is. It started out just as a question regrading how automation affects wages. It ended up as a synthesis of classical economics and task based models of the wage. To understand it though you don’t need to have read that work.
NOTE: This theory has now been formalized, with significant help from Claude Fable 5. You can read the formal version here: Pinning the Wage to Scarcity and Technology by Johan Båge, Stella Wilson :: SSRN. It is slightly different in a few areas from what is here in this blogpost, just to keep the formal version a little more narrow. During formalization we found some small issues with the wording here in this post, some of them I’ve fixed, others are just slightly imprecise generalizations (and this piece is already so long I dare not make it much longer), but the core is still the same and still holds, as far as the two of us can tell.
(Also, to any economists reading this, this entire piece is a static model across decades, so many dynamic systems, including the monetary system itself, is saved for a dynamic extension to the model. It holds decently well for measurements made on timescales between human generations and dynamic economics, so on a range roughly between 80 and 20 years)
To start, scarce resources. Scarce resources are the inputs to the economy, maybe your first thought is rare earth metals but we can consider three kinds of scarcity:
Physical scarcity: ore, land, air, water, oil etc.
Institutional scarcity: Scarcity set by laws, could also be called artificial scarcity. Patents, copyright. Monopolies can also introduce a kind of scarcity, and if we have a legal monopoly it’s Institutional scarcity.
Dynamic scarcity: Scarce only insofar as it takes time, something like a nuclear plant taking 15 years to build is dynamically scarce. Capital itself is dynamically scarce. A monopoly or set of inefficient actors (eg from an oligopoly) that is hard to dislodge due to regulation or network effects but ultimately is not legally enforced straddles the line between institutional and dynamic scarcity, but given infinite time is indeed dynamic scarcity.
I believe it’s valuable to be able to focus on physically scarce things, because the other two either we can change, or we can wait for. One interesting question, what are we? Our labor is economically a good, so what kind of scarce is it? Arguably it’s dynamic, people are born and die, but that’s somewhat macabre, so let us put them into the group of physical scarcity. That’s to say, for this paper, we claim that we should not wait for people to be born or die for the economy to come into equilibrium. You might disagree with that, but I’d ask you to accept it for now. With that, our scarce resources can be talked about as:
Land
Labor
Land because it contains most (but admittedly not all) our scarce resources. Iron is in ore in the land, or it’s in the buildings on the land, or it’s in the scrapheap on the land. Crops grow on land. Oil is under the land. The exceptions are, well, air and water, and they matter, but I’ll return to them later.
Labor is scarce because there are only so many people on earth, and there are things we can do for eachother that land can’t (at least, not yet).
The economy uses money, but money doesn’t actually have any value intrinsically. We just use it as a medium of exchange. In theory though it represents value. One such representation is the wage. You are paid based on how much you contribute to the economy, paid more if you contribute more. How are wages set in aggregate? First, the minimum reasonable wage is at the subsistence level, the level needed to survive. That is an old observation and “wrong” for a few reasons, but it actually will serve us quite well for now. It’s wrong because if you look around many people are paid more than subsistence wages. In part, that is due to human heterogeneity (we are all different) and the fact that the economy is always changing, and that change can temporarily move prices. There is one more natural system though that raises the true minimum wage above subsistence, but I need to lay some groundwork first. However, our collective minimum wage is actually subsistence, i.e what we need to survive. Why? Because if it were less than that, we would die and then we can’t work. One last component worth considering is all our tax and redistribution systems we have, which generically lift people at the bottom up by pulling down those at the top.1
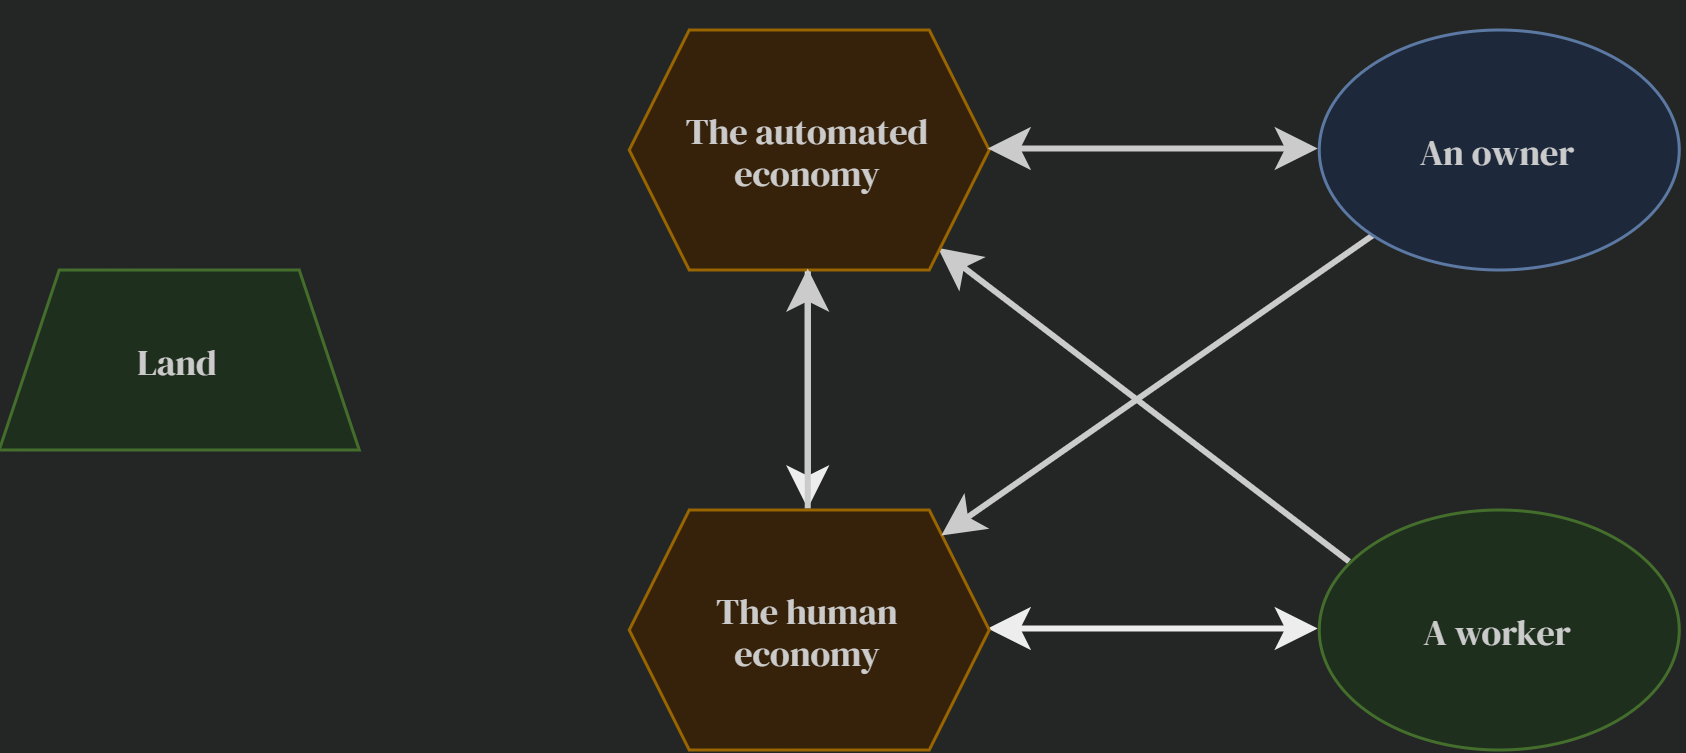
The thing is, this rule of subsistance-survival applies to the land, sortof. The most poetic example is climate change. Our earth (now including water and air alongside land) can also die if not treated properly by the economy. It currently does not really demand a wage beyond some token things our governments do (like a carbon tax), so it isn’t represented very well in the economy. Here is a diagram where I will include it for now but omit any connections for it (they are almost not there in the status quo, not in the way I want to talk about). This diagram is a bit naive, but maybe one that most think is intuitive, with owners and workers cleanly separated, as distinct individuals. An incredibly important part of this model is that no individual is ever in only one of these bubbles, we’ll get to what that means in a minute.
Each arrow is a flow of money, but more precisely, a flow of value. I get a wage for working, I buy a good from a company, an “automated company” purchases services from a human one, or vice-versa. Notice all are bidirectional except for two, because a worker is not paid for the work done by a machine and an owner is not paid for the work done by a human. Just as our two person bubbles are conceptual, the two economies are also conceptual, that “automated company” doesn’t actually exist (yet). Every company on earth is realistically a bit of both. One CEO and a billion dollars of machines, is mostly automated, but the CEO performs some labor by setting the correct direction for the company. A thousand farmhands using sickles is mostly labor, but the sickles are a form of automation. Here, one begins to understand what I mean by “Owner” and “Worker”
If you work and own stock, you are somewhat owner and somewhat worker. Even if you own only the clothes on your back, you are an owner of the material in those clothes. That might seem strange but that material is scarce, and owning anything scarce makes you an owner. Clothes make you more productive at work (I assume), so when you wear them to work, they are representing the automated economy, and you extract their value through the fact that you own your clothes. I have colored owners as blue because they are not scarce resources like land and workers. Already from that, you may be able to see a faint glimmer of what this whole theory is about.
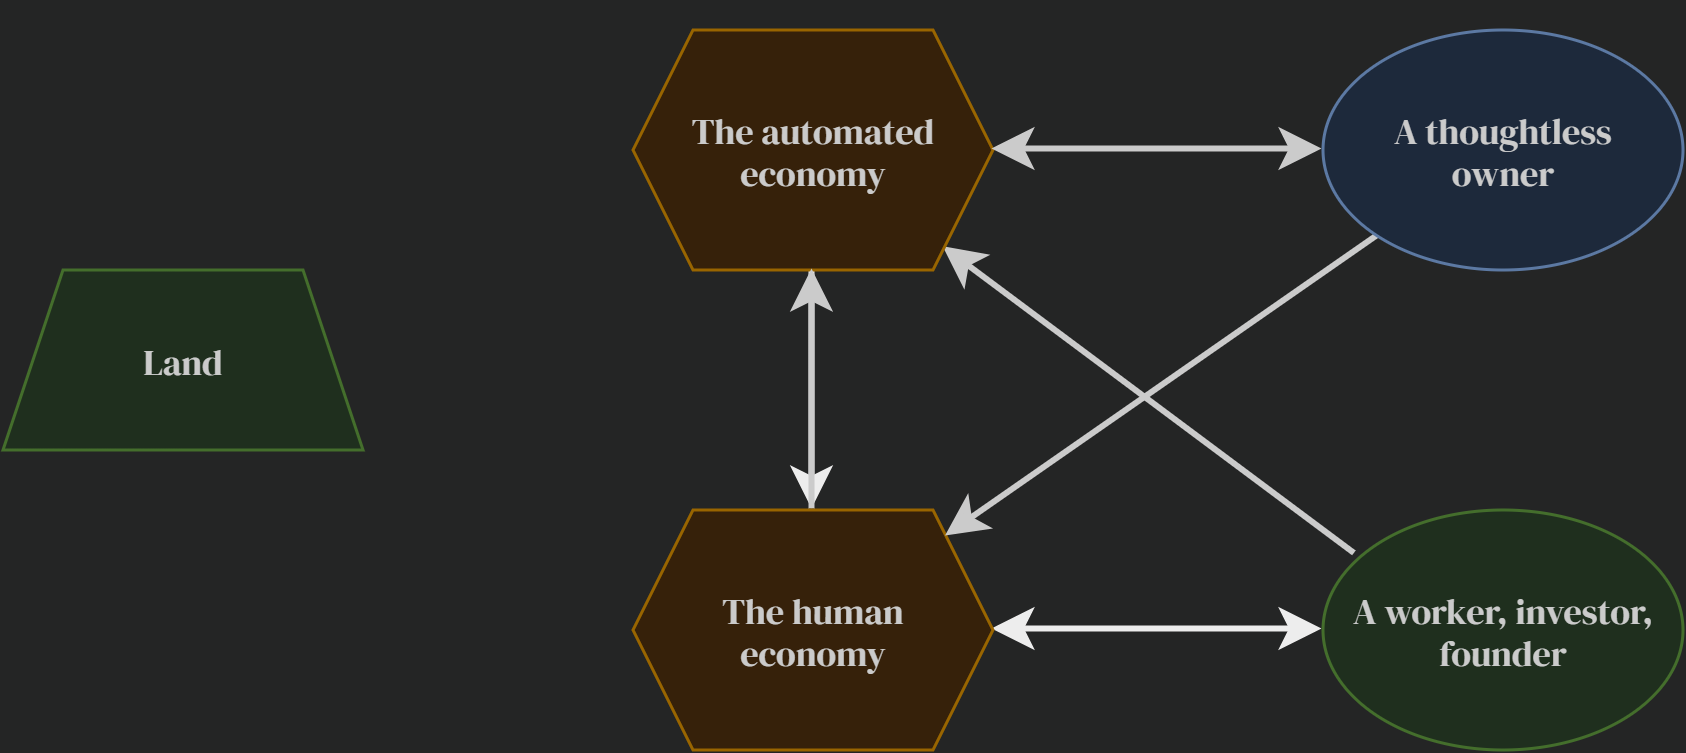
Let’s return to the two arrows coming out of the automated economy. One is to owners. Here, if you own something scarce and take value from it, that’s one of those arrows. Notably, I don’t pay myself for owning my clothes, so the arrow is representing value but not money per-se. The same is true of the arrow flowing to the human economy. In a company, very rarely are we modelling the flow from the sickle to the farmer with money, although from the billion machines to the CEO, we can definitely argue that that is a monetary flow. Their wage is inflated in excess of their labor because, through their position as ceo, they have influence enough to act as an owner (In economic terms, this is rent seeking behaviour). A similar fact is true for shareholders, they provide labor by picking good stocks, but if they hold them without considering the value whilst still voting for a dividend, thoughtlessly, then they also act as rent extracting owners. In a fully competitive model economy, this can only happen if you have true control over a scarce resource. A shareholder can’t thoughtlessly extract a dividend if another company could notice that, lower prices, and compete with them. So, thoughtless extraction can only happen when competition is in some way limited, through laws directly or through property rights over scarce resource that are rented out rather than sold. At this point, you might think I am taking aim at property rights, or rules like patents and copyright.2 I’m not, they also protect us from eachother. Stealing is a form of rent seeking behaviour too. So is war. Someone produces something with effort, and takes ownership of that thing or another thing (you sew your own clothes, or you work to buy clothes). That ownership is very rarely truly forever. Patents and copyrights expire, machines rust, even your clothes get run down and at the end you throw them away. When that last step happens you relinquish your ownership even though technically, in some sense, that fabric or metal still has some value. The point is, it has its scarce value. It started with it in the ground, and it ended with it in the landfill, it never lost it or gained it.3 That scarce value is entirely fixed, and it’s a function of what we humans can do with it, and how much joy and utility we theoretically can gain from it. Theft, fraud, war, all these break the natural cycle of the economy in a way that is rent seeking. With that, here is a better, clearer version of this diagram:
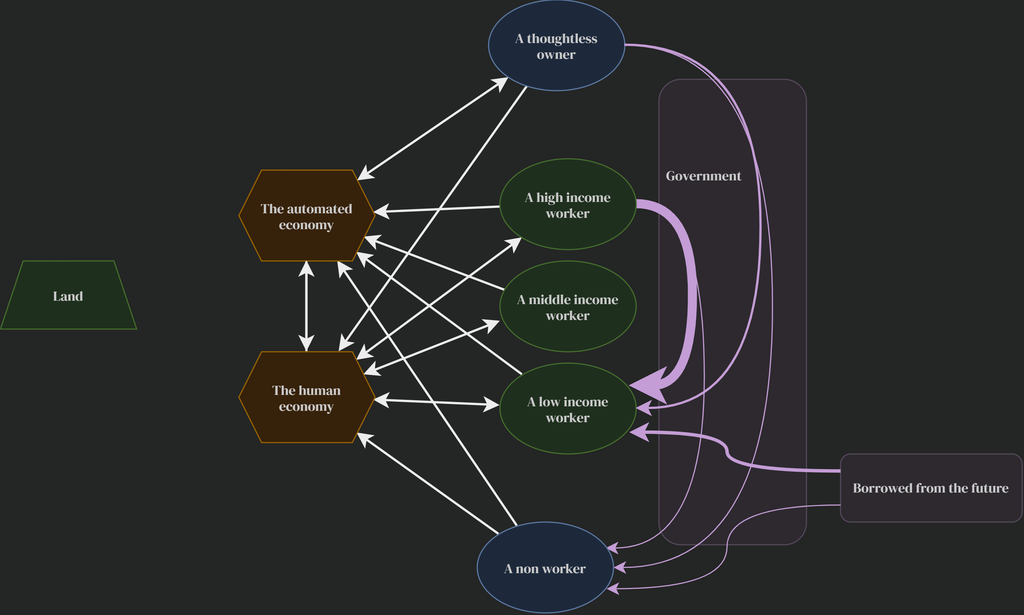
A thoughtless owner is one which owns something but puts no more effort into it. Perhaps they put previous effort into it (during which time they were a worker or an investor or a founder), and therefore should be entitled to some returns, but they put no continuous effort in anymore. Before, I said humans are heterogeneous and redistribution plays a role, so here is that diagram:
What is extra notable here is the only arrows going out of the automated economy are the ones flowing to owners and to the human economy, I’ll return to that later. Once again, the human blobs here are conceptual and it is arguably impossible to be only in one of these blobs as an individual. A new member you may have noticed here is “non workers”, conceptually this is someone who does not own anything and does not work. Given we said that owning even just clothes makes you and owner, this individual doesn’t really exist, but here they have to be added to show how government policy treats these two as separate
Government sits to the side, and it can collect from owners and workers, and distribute also however it wants. In a democracy, however we want. The arrows here, which way they point and their size, is dependent on policy. Our conceptual middle income worker is one who gets back what they contribute (definitionally, just so there are fewer arrows on this graph). In most countries, we tax high income workers and distribute to low income ones. Borrowed from the future is deficit spending.4 What might surprise you is that the line from owners is (usually, in most countries) small, and the line to non workers is also very small. The short version of why is that most of our taxes have incidence on wages, and most our benefits are conditioned on past or future work, linking them to wages. Income taxes and pensions are the obvious examples. However I would include other less obvious ones. On the tax side, non exhaustively:
Income tax, obviously
Consumption taxes like VAT and sales tax – This is because most consumption is paid for by wages, or by benefits that are funded by taxes on wages. Not all VAT though, consumption from owner incomes (I own stock, collect dividends or use it as collateral on a loan, buy a thing) is not wage linked.
Property/council tax – It taxes the labor that went into building the building or improvement. Like VAT though, it’s not a pure labor tax.
Profit taxes, and even wealth taxes – Also not a pure labor tax, See below
Even a profit or wealth tax taxes a smart investor or decisionmaker, their cognitive work is labor, and therefore when we tax it we collect from labor. However, e.g wealth taxes also tax wealth gained from say, owning a global index fund. No thought is needed to do that, so that sub case is a pure tax on ownership, but since it’s entangled with a tax on the intelligent allocation of capital, wealth taxes aren’t pure. On the benefit side we can consider these as wage linked:
Pensions – You have to have worked in most cases, and it grows if you worked more
Unemployment benefits – You used to work, so it’s still wage linked
Any benefit that dissappears if you start working, or get a higher wage, are also wage linked. Even free/supported education is wage linked because you are meant to start working at a certain age, and can only get free education for so many years in most countries. Free healthcare is wage linked if it’s payroll funded or income conditioned.
The size of those arrows is roughly representative, but not to scale. The one that is most important is that if you are not a worker and not an owner, you receive almost nothing (maybe a few percent of consumption flows in the USA, I’m working on the exact numbers but the nature of this decomposition makes this exceedingly hard). This is relevant for later, because it means of our blue bubbles, you actually need to own things to be able to buy anything, if you don’t work and don’t own, the government will pay you nothing.
Loops
That’s a lot of text so soon it is time for more diagrams. I will collapse workers back to just one blob and remove income redistribution arrows, because they are not the topic of this piece.5 Instead, and this is most important of all, I will merge owners and non workers. They are identical in every respect except how government policy treats them. By our definitions, an owner performs no work, not even a lazy afternoon stockpick. They are one and the same. (and also it means I can remove the government box, since with merged worker levels and merging owners and non workers, it would have no meaningful arrows (isn’t that interesting? no big arrows? Almost no government in the status quo given this framing? I’m being coy because I’m getting excited, you can too if you want)).
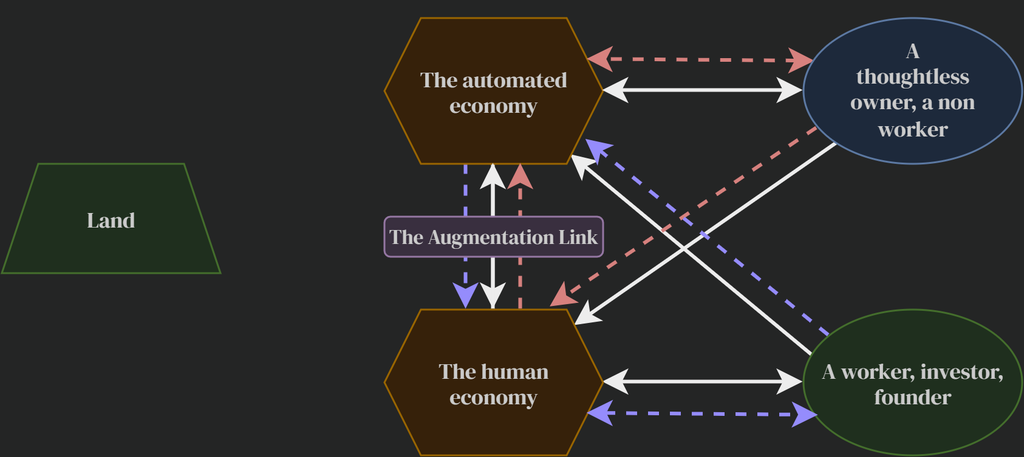
To illustrate what’s going on here, let’s talk about two loops
The labor loop, in blue
The owner loop, in red
The labor loop is the one we are familiar with. The smallest incarnation is me doing something for a friend, and a friend repaying the favor later. The biggest, conceptually, is our entire human economy to every worker (the lowest arrow in the diagram, a bidirectional loop). We also include the cycle between worker -> automated economy -> human economy -> worker as part of this loop. That’s because if I purchase something, maybe through a webstore rather than a cashier, in some sense the first step is an automated one, and then it might go to a human, and then it might eventually get back to me.
The owner loop is the bidirectional arrow between the automated economy and our non worker-owners. I own my clothes and in my free time I enjoy wearing them all on my own, it’s a fully closed loop. I thoughtlessly own stocks, I use it to buy from companies (both economies, so it includes owner -> human economy -> automated economy -> owner), and at the end of the day the value flows back to me.
All of this seems well and good, money goes round and round, what’s the issue? Owners pay workers as they buy things that need humans, it’s a kind of trickle down economics, and even if it doesn’t work great all the time, it’s still theoretically sound right? The key part is the Augmentation Link, and to discuss that we need to talk about technology.
Technology
What does technology do? It allows us to take the things that land provides and do things with it. A lump of iron does me not much good. Iron used to make a building gives me shelter, and technology is what makes that possible. It also makes it easier, cheaper. In theory I can pile lumps of iron by hand into like, an igloo thing I guess, and live in that. Technology can give me a much nicer house, and it can do it without me doing as much hard work. But, it has taken igloo building from me. This is fine by me, I will forsake the joys of igloo building for a nicer house. However, in a simple economy, that house would never be built for me. Even if I have all the technological knowledge in my head or in a book close at hand, it is only built if someone else, another human, does some other labor for me (at least, for now). Then I do some labor in return, and that is the economy. Crucially, it works because of the link between the automated and human economies. If the iron can’t be turned into a nice house without a human, then I can sell that human my labor to get them to do it for me. If the iron to house building is fully automated, I can’t ask the machine to build me a house because the machine wants nothing from me. It only works if I own the machine, and I tell it to build the house for me.
That’s all very abstract but what does it mean? It means that technology only helps us if it needs humans (or if we own it). It’s capability overlap with us is not uniform. It can lift a ton of iron, but it needs a human to know where to put it in the smelter. In our loops, the owner loop and the labour loop, differences in capability to produce an output good is what links the automated and human economies together. Now let’s look at history, in four arcs:
Prior to the industrial revolution, subsistence was commonplace. We lived, but not much else. Technology had not gotten very far, labor had to do most of the work. If technology improved, temporarily things may get better, but they get optimized back towards subsistence for most.
The industrial revolution created a massive capability non uniformity. Physical labor was mostly automated, cognitive labor almost entirely not. Any good or service that requires both links our two economies tightly, and there are a great many such goods. Humanity flourishes.
We develop computers, and the simplest cognitive tasks are automated. The link weakens. The great stagnation, an observed disconnect between productivity and wage growth, happens around 1970. Also around 1970, Moors Law begins to be observed.6
We develop AI, and technologies capability is becoming uniform again. The link weakens further. If we do nothing, wages will drop towards subsistence for those who do not own, even though they don’t have to.7
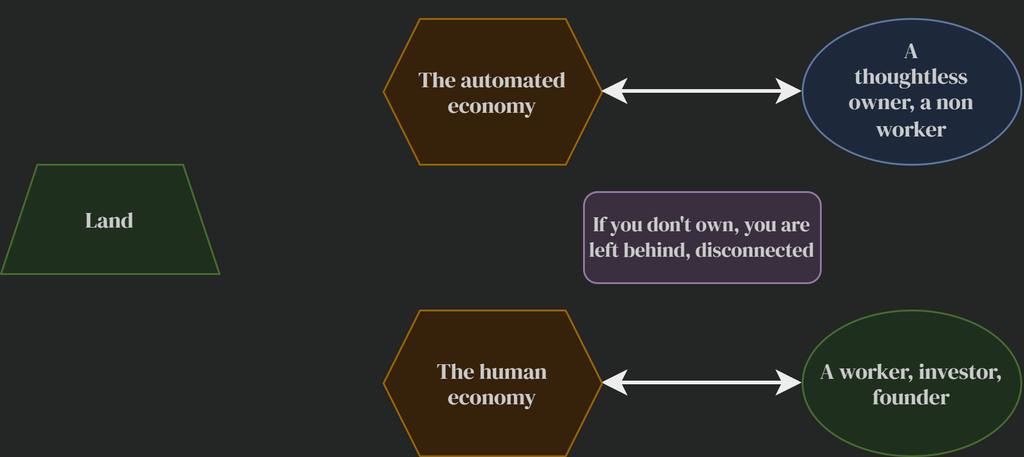
This is what our economy looks like with no link. A hypothetical to be sure, but it is illustrative:
That link, and the strength of it, is what lifts the true minimum wage above subsistence, which I foreshadowed earlier. It’s “natural” in the sense that you don’t need to use policy for it to exist and work, but it isn’t fixed nor monotonic, it can go up, and it can go down, and whether it does is a function of how much human labor can be multiplied by technology whilst not replacing the human labor. It’s augmentation versus displacement. Technological progress which is high in augmentation and low displacement is a historical oddity, it’s not a guarantee, and indeed it may well be encouraged to invert. Technology is rarely forgotten, and if we make the claim that it has some diminishing returns, meaning the next iron efficiency gain is harder to find than the last, the economy will go looking elsewhere for efficiency gains, and replacing people becomes a relatively more lucrative one. We’ve had more displacement than augmentation for the last 50 ish years, by my interpretation of the findings of Acemoglu and Restrepo.8
The solution
We can fix this, but most of the systems we use today won’t work. Any benefit that you only get if you work at some point in your life forces you to find work, even if the economy can only give you a crap job. A crap job includes both one that pays little and requires you to work many hours (like in the gig economy) and one that is just make work, inefficient, even if it pays decently well. Even worse, if our taxes come mostly from wages (they do), as the jobs get crappier the amount that we can collect gets smaller. That is the pain our governments have been feeling for the last 40 years.
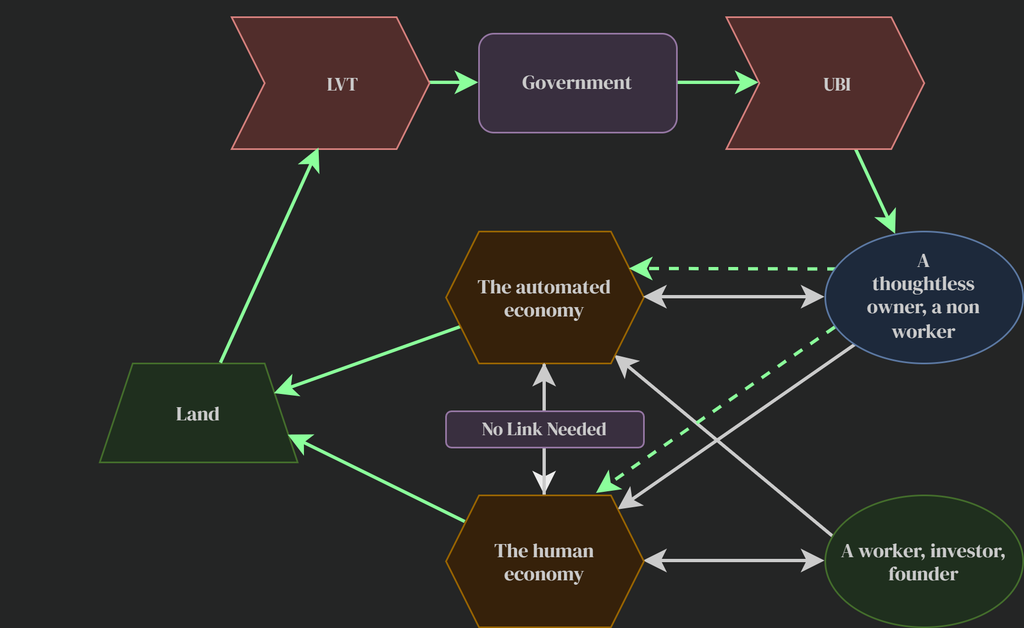
The fix is to build a system that isn’t tied to wages, a new, third loop. What I will add is a kind of tax and a kind of benefit. Conceptually, I want to add non labor linked tax on physically scarce resources, and a non labor linked benefit. Practically, I’ll use the terms LVT and UBI going forward. LVT, Land Value Tax, is famously non distortionary and effective, but only on paper, it’s very rarely actually used. It’s non distortionary because nearly all economic activity has to use land. It’s easy to enforce because land cannot flee, it’s hard to hide (from what I’ve heard, you can see it from space), and its value changes slowly. UBI is better known but also never really used, the closest is something like Alaskas dividend. If you’ve heard of it and don’t like the idea, all I ask is this: can you come up with a different benefit that doesn’t contain the word “job” in the description?9 Good luck. Anyways, let’s plug it into our diagram.
The land loop is the one in green we have constructed with LVT and UBI.10
Notice that this system does not touch workers. That’s not an error in the graph, remember, no human is in just one of these bubbles, but that “part” of you that receives the UBI is the part that does not work, and everyone receives the same amount. Think of it like the time when you are asleep, or taking care of kids or grandparents, that is receiving the money. The UBI is stating that you have value just by being alive, not only when you clock into work.11 Incentives to work are essentially preserved, and in fact they are significantly more efficient. We don’t need politicians fighting for contracts to make jobs in their districts, unions can focus on worker safety instead of just wages (Assuming there is no monopsony), a painter paid by you no longer get’s 80% of your wage eaten by taxes.12
Another way to think of this is that it implicitly makes every individual an equal share owner of all the land and by extension natural resources within a nation state, scaled by the level of the LVT. This is essentially the same argument as Henry George made many years ago, although when I first formulated this, I didn’t even know who he was.
Protecting the planet
Our LVT without a floor allows us to claim the value of land, and the UBI allows us to spend it on things we want. If we only had these two, we might kickstart a new fantastical age of consumerism. One way to limit that is with the floor on the LVT, the pigouvian component. Setting it high and not spending it on UBI is essentially saying “if we consume too much, we will kill our planet”. Admittedly, spending it on anything wage linked has a component of increasing consumption, but conceptually it works. We set the ratio of floor to slope in the LVT to balance these two. Literally ax + b, higher b is a higher pigouvian component, higher a means more extraction from land that can be spent on consumption.
A fourth component
So far, we have a flat LVT, a scaled LVT, and a UBI. There’s another neat thing worth adding to this system, if you want redistribution amongst people. I leave it at the end here because I really, really don’t want anyone to relate this too much to the Great Debate that already rages every day, but it’s worth mentioning. We can fund some of the UBI with a VAT instead of LVT. All this does is flatten the consumption curve. A high income earner that buys lots of stuff is taxed more than someone who buys little. But if the VAT is flat, and the UBI is flat, then that acts to redistribute buying power from those that buy many things towards those that buy few. It is nicer than using income taxes or profit taxes or wealth taxes because the money from the flows that those taxes tax can be saved. If someone saves money, me putting cash under a mattress or a billionaire that doesn’t spend their net worth, it hurts no one. Money is just paper, or even just electrical potential on a computer. What matters is when I go into a store, can I buy the things I want. Whether I can or not is a question of how the economy is set up, not how big a pile of almost worthless paper exists in a corner of somewhere. Money only truly changes the state of the economy when it is spent, not when it is collected or stored. Why? Because spending, consuming, is me telling the economy “these are the things I like”. If I’m rich and I like yachts, and buy yachts, the economy will allocate iron to making yachts instead of something else. If I buy bread, it makes more bread. To tax peoples wants and desires properly, you should use a consumption tax, VAT, and not anything else. You can also make it pigouvian rather than redistributive depending on how you spend it. Pay into the UBI and you redistribute from rich to poor. Fund carbon capture or sea cleanup or other ways of taking care of our earth, and you trade off consumption for taking care of earth and limiting how much we extract from it.
I haven’t run the numbers, but probably the smoothest operation (in terms of not causing crashes and shocks to the economy) is to use VAT incomes for such earth maintenance at the same level as the pigouvian LVT floor. So if you spend 100$ on carbon capture, it would be smartest to get 50$ from the land base rate and 50$ from the VAT.
A fifth component
All of this is about a single, closed economy. The real world is very globalised. Land can’t flee, but ideas can, trade can, and what does a country do if its land is, well, crap? The answer is a buy side sovereign wealth fund. Take the money from the 3 income components and put some of it aside into a fund that buys the stocks of companies in other countries. Preferably, buy stocks in the companies that provide the goods your nation imports and cannot or does not produce itself. This is essentially what Norway does to great effect. This isn’t as pure and perfect as taxing scarce resources directly, for example, if we owned all the stocks, there would be no stock market and then no reason for savvy investors to find good opportunities, so optimally countries should swap land rents rather than build sovereign wealth fund war chests, but for any practical implementation it’s worth having.
System summary
We now have 5 components that we need to balance, 3 that produce income and 2 that absorb it.
A flat LVT rate per acre
A LVT rate set relative to the value of land
A VAT rate
A flow into or out of a sovereign wealth fund.
A UBI
Balancing them isn’t trivial, but not as hard as one might think. I’m working on getting estimates for some countries.
What does this all mean?
We live off of our earth, and yet our economy lives off of us (mostly, around 2 thirds of all consumption, and most people live off eachothers wages, not their assets). Technology makes living off our land better, and yet, our economy only sees that when our labor and our machines are linked. Machines doing the physical, and us doing the cognitive, was a pretty good deal. A tight link. But technology always advances, and as its capabilities become more uniform again, the link erodes, and our economy loses sight of the thing we actually live off of, the land. We can balance this properly. Tax land and we give it value, the economy sees it, uses it properly. We then can lift our true minimum income above subsistence, by adding the proceeds to our wage. Tax consumption and we put a price on it, reigning it in, which we can do directly with VAT or indirectly with a floor on land taxes, paid not to people to consume but to protecting land (or us, in other ways). Otherwise, pay that money out to people, and pay it uniformly, because the economy is already doing the job of setting wages. If we want, we can redistribute further, from the more capable to those less so. That I leave up to you though, and if we can work in this new model of the economy, for once in our history that can be a fair debate rather than an impossible one.
The floor in the LVT is what allows us to say “Our earth has some intrinsic value to us, even if the economy can’t see it”. The UBI allows us to say “a person has some intrinsic value to us, even if the economy can’t see it”. We can do without these concepts if we have some other link to our land, but technology doesn’t guarantee us that link, and I’d argue it’s currently removing it. Technology giveth, and technology taketh away, if you’ll allow me to be a bit poetic.
I’m still working on the theory, mostly to put numbers on it so it isn’t just me waving my hands about. Some of the numbers already exist in fables formal version here:
And some months ago we also looked at a VAT funding UBI, which is even easier to model, for which I have some of the numbers for the USA and Finland here:
Disclaimer on AI use: I did not use any AI to write this piece, although some spelling checks I did get from Claude. I’ve also gone back and forth with Claude many times to check sources, refine points, and find the core of the idea prior to sitting down and writing this. The linked post above uses AI much more, both to write, and compute the various graphs.
Footnotes:
I have a tangential thought that is bold and inflammatory and so I put it here in a footnote, since I haven’t fully thought it through. This dynamic is why redistribution amongst labor can never work as we would like it to. In a hypothetical pure labor linked economy, with no automation link, the minimum wage will always be at subsistence, i.e there must always be someone who lives at the level of subsistence if all our money is labor linked. If you try and raise up the poorest you can only ever do it temporarily, and you drag down our mean. In that setup, inequality between people is the only way for anyone to be above subsistence. Linking this to automation, if automation makes our capabilities more uniform, it pushes everyone towards subsistence regardless of what human->human redistribution systems we have. Perhaps that is why redistribution has seen such pushback in the last 50 years. Paradoxically, perversely, to raise the mean humans standard of living you can use inequality, and the lowest person will always be at subsistence. The only exceptions to this are the mechanics of ownership, and hopefully, our solution. Edit: during formalization, this claim has become a fair bit stronger. Full paper linked at the top. ↩︎
Patents and copyright are an interesting case. In theory, they allow you to collect value from an idea for some amount of time after the public receives it. The reason they exist is because ideas are otherwise extremely easy to steal. Although duplicating an idea costs nothing, it did cost something to come up with in the first place, at minimum, subsistence. The cost was paid before the thing came into being, and if it is copied on day one, the creator pays that cost and receives nothing in return. One alternative resolution is our UBI. An author can write if that is what brings them joy, and a UBI lets them do that without worrying (as much) if their idea will be stolen. But for a billion dollar investment, a UBI just cannot cover it. Since we cannot foresee the value of an idea prior to it hitting the market, and the idea could be readily stolen, we likely still need patents and copyrights. Setting the right time limit is hard but important. Too short and someone else taking the idea is rent seeking. Too long and holding on to the idea is rent seeking. In a perfect world they would last for as long as it takes to exactly offset the cost paid, but that balance is not something the economy can easily find for us. As a fun aside, this dynamic is currently hitting Anthropic and OpenAI pretty hard. Model weights are just numbers. If you could hold them all in your head, I could call it an idea. That’s why they have been so easy to distill, and arguably patent law should have protected the AI labs. The real ownable thing is, surprise surprise, the datacenters, the land the datacenters are on, the energy sources to supply the datacenters. Even if AI ends up being worth a bajillion dollars, my money is not on the people who only have an idea and no patent. Although I do feel a little sorry for them. ↩︎
I received some good responses that it might be worth talking about thermodynamics here. Ore in the ground is perhaps easier to access than metal in a scrapheap. I say perhaps, because for cases like gold mining scrapheaps is actually profitable. The real underlying question of value is then two components, first, the amount of scarce resource, and second the energy necessary to reconstitute it into something else. In a very pure thermodynamic view, our earths most renewable energy source is the suns energy and all things directly downstream of that. All scarce resource amounts are fixed, and what changes is the energy necessary to do something with them. It’s an interesting theoretical framing but it isn’t thaaaat important from an economics perspective. ↩︎
What’s not shown in the government spending arrows are the interest payments our government makes. It makes them to the owners of debt. In the US that’s mostly existing domestic wealth, but it acts as a flow from all workers towards all owners, but not evenly of course, wealth weighted. Because most people aren’t actively making investment decisions regarding which government debt to buy, the vast majority of interest payments from governments are to thoughtless owners. Contrast that with interest paid to an angel investor or someone that actively chooses bonds to buy, that would then be labor. ↩︎
These arrows, from high incomes to low, are usually what we talk about when we talk about taxes and benefits. Even when we talk about wealth and profit taxes, we are mostly talking about this. It’s a centuries long debate, and to be honest I believe footnote 1 is the reason why we never resolved that debate, and if we do not increase the non labor-linked money flow, why we never can resolve that debate. ↩︎
Also around then, the dollar is disconnected from gold. I genuinely think this is either a coincidence, or even one could argue the causality goes somewhat the other way (a weakening link driving economic shocks that then led to dropping the gold backing for the dollar) ↩︎
According to Korinek and Stiglitz we could actually go below subsistence, and that’s true but it’s important to describe what that looks like. It can’t actually go below subsistence if defined as “you die”. Instead, if the economy could not pay me enough for me to support myself, rationally I would just drop out of the economy. The thinking is this: in theory, if I tried hard enough, I could go into the woods and live off the land. That would be my subsistence. A rational agent who’s labor provided to the economy is worth less than subsistence to the economy doesn’t stay in the economy, they become unemployed. In practice this looks like becoming a dependent usually, in particular because I can actually provide my value to, say, my mum. Economics would tell us that that is impossible, in such a scenario my mum would pay someone else to do it better, but economics can’t see the value I personally have to my mum, as her child and family, so she takes care of me even if the economy never would. ↩︎
The reinstatement effect and augmentation are the same. They only appear different because the former creates a new job seemingly out of nowhere. In some pure sense though, that job always existed, it was just economically underwater, not augmented enough to employ anyone. Augmentation improves until suddenly the job description comes into being. I could babble about programming languages and carve algorithms into tablets a thousand years ago, it’s just nobody would pay me for it. Soon nobody will pay me for it once again. ↩︎
I think it should be based on number of instagram followers, because that would be funny. ↩︎
Notably, implementing this LVT has created a flow from the two economies. In that sense, it’s not like a tax we might recognise. Most taxes tax existing flows, a 50 percent tax taxes half of something nonzero, half of a wage, half a dividend, half an inheritance. Land doesn’t earn much rent, at least not if you average out across all land (an individual plot may earn a lot). In fact, the rent it does earn is set very similarly to how aggregate wages are set. The difference is, land has a subsistence wage of 0 (usually). The worst, crappiest land can demand a rent of 0 on its own. If it’s land that I can see some value in that’s better than other land (it is beautiful, temperate, has iron ore deposits that other land doesn’t) then it can command a nonzero rent. Heterogeneity once again makes the mean rent of land be above subsistence. Anyways, for our LVT, we apply an absolute floored tax. A number of dollars per acre minimum, then scaled up by the value of the land. You don’t actually need the floor, at least not in theory. You can put the base level at zero and use an honest to goodness tax. In practice we add the floor to make it partially a pigouvian tax. Even the lowest value land doesn’t have 0 value. 0 value land is land we dump on and take for granted. It’s land we pretend we never will need, even if maybe one day we will. It’s pigouvian because it’s in excess of what the market believes the price to be. The income from the floor should not go to the UBI, it should go to things that mitigate the harms, the negative externalities, of improper use. The floor tax discourages abusing land, the income from the floor deals with damages incurred. Notably, taxing air and water is hard to do for a country. Land is very closely linked to all economic activity, so putting a floor there is a very good way to collect and then spend to not just preserve land, but air and water as well (for example, carbon capture, if we should want it). That’s slightly distortionary, so if at some point we realize we are all living on water cities for some reason, give me a call. ↩︎
It’s here that our choice earlier of putting labor in as physically scarce comes up. If you don’t do that, this conclusion doesn’t work in the same way, you can just wait for people to die or move to another country or become completely dependent on whoever they know that actually owns something and has positive net worth. ↩︎
In Sweden, if you calculate what wage you need to earn to pay a painter 50$, it’s 5 times as much, 250$. Because first you get taxed, and then the painters firm gets taxed VAT, and then the painter gets taxed, and it all adds up. Sweden has what’s known as RUT avdrag that reimburses about 30-50% of this, but that’s not all and also it is only for some kinds of labor. ↩︎
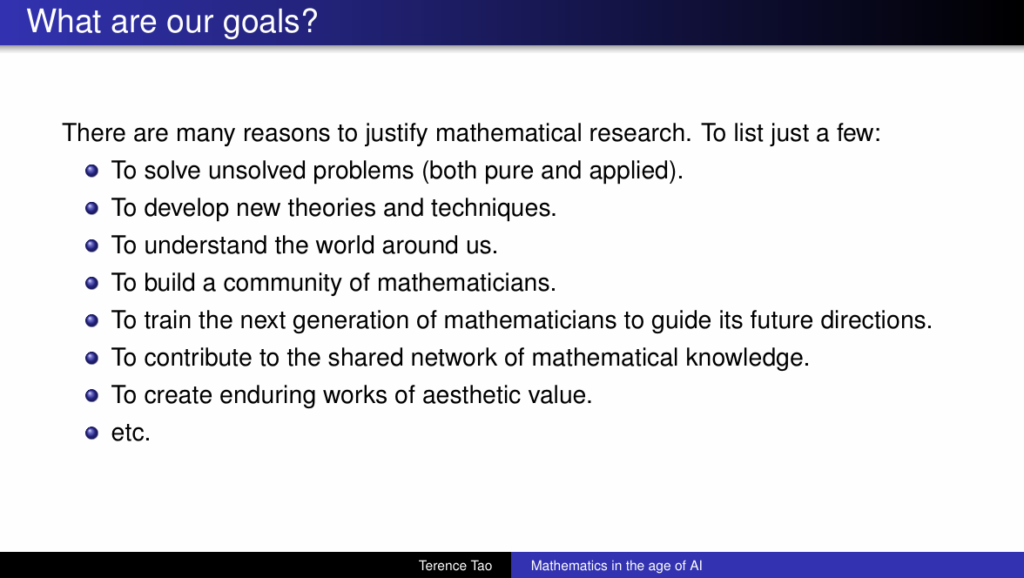
Terence Tao recently did a very good talk at ICM about how AI, in particular LLMs, is changing the field of mathematics. I strongly recommend reading it before reading this post (or even, just reading it and skipping this post, I won’t mind)
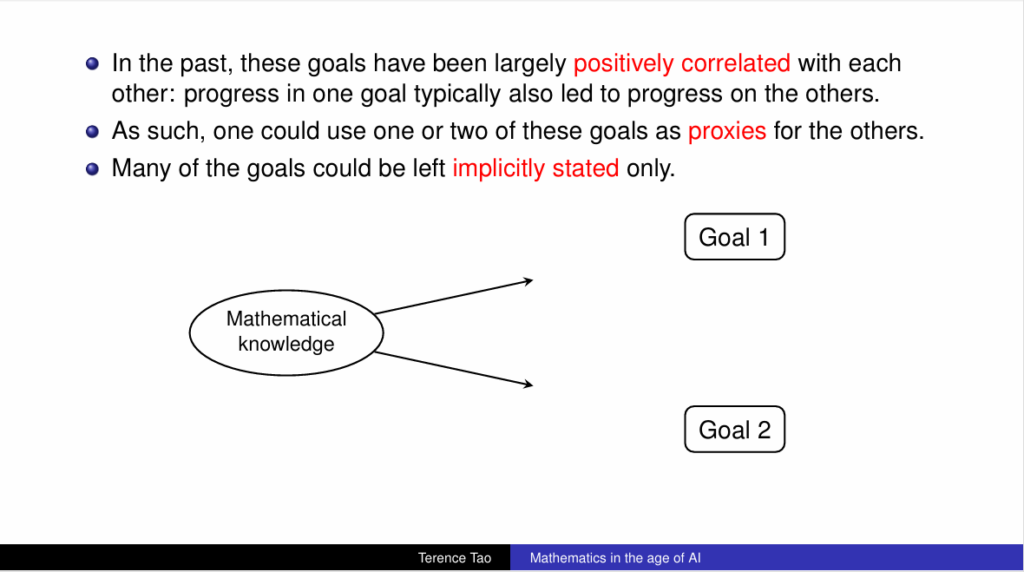
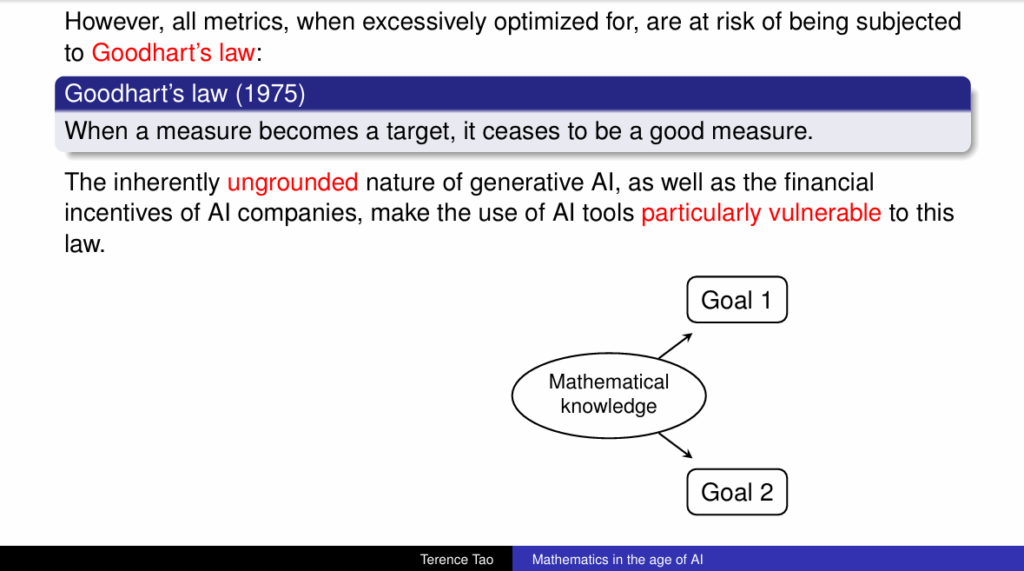
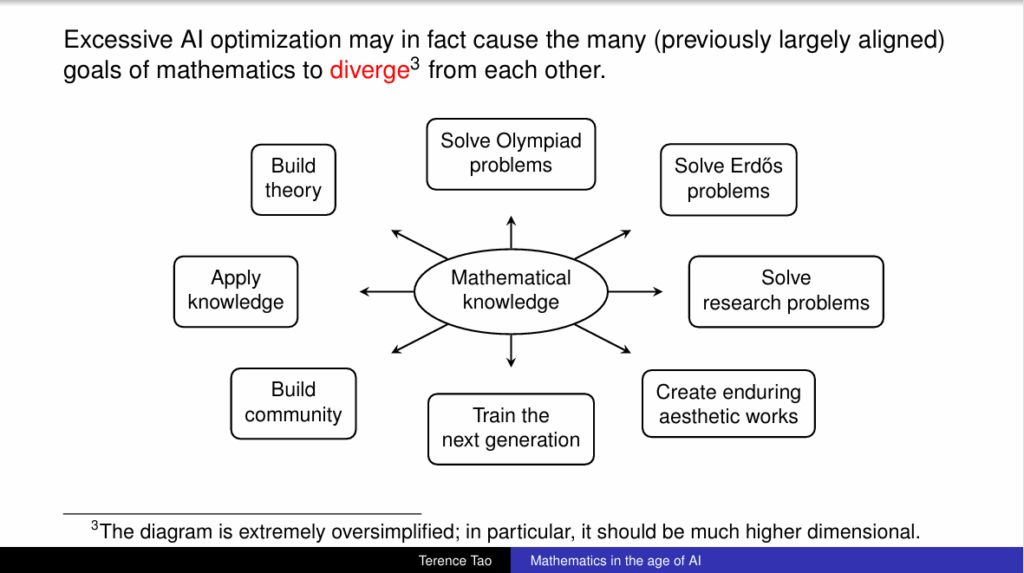
In it, he makes a key observation about the alignment of different goals1:
What’s notable about this observation is it trivially generalises. I want to apply it, as best I can, to something I’ve been working on and writing about for a while and might make what I mean easier to digest.
The economy is itself an optimization engine with many moving parts. Usually its goals are aligned with what we want, and when it is or isn’t is one of the longest running debates of all time. We use regulation and taxes and subsidies and benefits and tariffs and many other things to try and align it more with what we want, debating over both how well that works and what our “wants” even are.
I’m not here to really bring up one of those smaller debates, they are already going on and I’m no expert on any of them. What I want to do is open up a new one that I think has mostly been missed. I’m no expert in this one either, but I don’t like the fact that I seem to be the only person asking this question. Anyways, enough pontificating, I’ll try and express it in a way analogous to what Tao was getting at.
Wages have two2 main functions, goals, in the economy.
Moderate the supply of labor.
Provide the foundation for consumptive demand.
By the first I mean: put people into roles the economy needs, encourage them to pursue valuable careers, pick the right degree, retrain if they become displaced, travel to where the work is in the country. This is currently a natural component of our economic optimization machine, it need not be pursued actively.
By the second I mean: almost all consumption is funded by wages. The obvious component is that if you are healthy, of working age, and engaging in society honestly, the money you spend comes from your wage. The less obvious component is that most government transfers, benefits, welfare, also comes from wages. Pensions are paid from a pool of collected wages. Income taxes tax peoples wages (perhaps not your own, but still, wages). VAT or sales tax is a consumption tax, but consumption is mostly paid by wages, so again, the tax is funded in large part by wages.3This goal is currently almost entirely coincidentally met by its alignment with the first goal.
What AI possibly may do (and an even stronger claim, what automation has already been doing for a few decades) is decorrelating these two goals. It is pursuing one whilst letting the other wither. The first is our target, optimize the efficient use of labor so work that needs to be done is done by the best people. The second is our measure, do you have enough worth to enjoy the output of the economy. When they are linked through the wage, Goodhart’s Law applies.
In some sense, we chose this state of affairs. Consuming from the economy is considered a privilege, and to justify your right to do it you need to prove yourself. Providing your labor has sufficed as that proof for a significant amount of human history. Is that still true, and will it remain true?
To examine this, like Tao, I set up a working hypothesis:
AI tools will, reasonably soon, become capable of performing a reasonable fraction of economically significant cognitive tasks, with reasonable levels of success, quality, supervision, and cost.
The only part I have changed from his working hypothesis is “research-level mathematical tasks” to “economically significant cognitive tasks”. I am under no illusion that it is equivalent to his hypothesis. Mathematics has had both an exceptional set of evidenced AI impacts, in excess of other areas, and it can be argued that the nature of mathematical thought is somehow different from the types of cognitive tasks the economy needs done. However, again like Tao, I will ask you to assume that the Working Hypothesis holds.
What does this then mean? If we would like the second goal to be fulfilled fairly, we must modify our societies, cultures, and policies to pursue it. What is “fair” may seem like quite a hard thing to pin down, like it is the very thing we have been arguing about forever. That existing debate is not the one I am trying to surface. The thing is, currently there is almost no distribution of the sort I describe. You might say “but unemployment benefits, social welfare, pensions, free healthcare, free education, are they not already making things fairer?” and the answer is no, not in the way I mean, not if those benefits are funded by taxes that are themselves coming from wages. This isn’t about one person versus another, it is all humans versus technology (and to be clear, I love technology, it’s just if the economy could run on just machines, it would, and humans would neither work in it nor consume from it. That seems like an odd state of affairs to have as our default outcome)
It feels exceedingly silly to be playing this existential game against technology whilst believing we can win. We assume that technology won’t continue to progress faster than, well, evolution. To turn the original understanding on its head, the game is currently too fair. We are largely playing on an even playing field against technology4, and yet we can tip the scales in our favor if we want, and I think that we probably need to sooner or later, or we will just lose.
I won’t outline in full my ideas for how to solve this, mainly as I have done so elsewhere on this blog, perhaps the best version is here. However, one thing that can be inferred from what we’ve discussed, a tax on its own is not enough, and a benefit is not enough either. A tax does nothing if it does not fund (human) consumption in some way. A benefit does nothing if its value is collected from wages by proxy. One needs to construct both, linked to one another in the same way wages are now, but crucially unlinked from a person’s capacity to prove their ability over a machine.5
Footnotes:
He also makes a fair case that one should always disclose AI use in your work. I did not use any AI when writing this piece, but the one I link to as the deeper dive is written in large part by Fable 5. ↩︎
Arguably there are other goals or ways to specify them. In the piece I link to at the end of this one, I also raise the fact that jobs (and by extension wages) function to structure the day, to provide community and purpose. This is obviously a very important function, and further changes will be needed to facilitate it. However, I don’t raise it here because I have a suspicion that work (what we might call the second space within third space theory) has, due to the problem I outline here, absorbed the third space through economic pressure (you can’t be part of your local club if you must work). Which then leads me to wonder if resolving this issue might see the return of third spaces, and therefore a recovery of community and purpose. ↩︎
There’s an interesting circularity here already. A government transfer funded by VAT and paid out to someone who spends it on consumption is entirely circular. It can easily be self sustaining, i.e one dollar of consumption, to one dollar of welfare, to one dollar of consumption with no losses. Then the person would be able to consume from the economy without providing any of their labor supply (In a fully automated economy, this is fine from an economics perspective, and indeed it is the only way that such an economy can have any non owners consuming from it). This “loop” is not currently a significant presence in the economy though. It’s hard to calculate precisely because of its nature as a loop, but it isn’t hard to estimate as being “quite small”. ↩︎
I know this seems weird, how can you play a game against an inanimate concept, especially one that could never desire anything? Logically, without people there would be no technology anyways. Here I actually can make a refinement I’ve avoided because it’s inflammatory and I think people will assume the wrong conclusion from it, so I keep it here in the footnotes: Humans are in fact playing the game against other humans, those other humans being those that own the sources of economic rents, such as owners of land or other scarce resources that the economy itself cannot produce (and therefore, is not a form of value creating ownership). To clarify, if you think this means I am against the concept of ownership generally, I am not. Ownership comes in multiple forms, and there is no good well known term for “ownership of things who’s acquisition wasn’t value creating”, nor is there really an easy way of measuring that. Luckily for us, we don’t actually need to measure it to deal with it, so long as we use the right economic tools. Framing it as “vs technology” can still be accurate. A big part of “non value creating” essentially means without effort, and arguably that also means without thought. If I am an investor and I spend a lot of time analyzing a company before buying shares of it, there is an argument that that is value creating ownership. I am contributing my expertise and mental effort into the economic signals carried by the share price. If I just buy the global index, arguably I contribute nothing. The only “humans” we are against, in this framing, are not individuals, but the technology that serves them thoughtlessly. That is why I think framing it as “vs technology” is correct. ↩︎
Again, that’s to say I don’t want to weigh in here on how we should judge one person over another. That mechanism is served already, it’s the “great debate” we already have all the time. One person over another is moderated by taxing wage linked things and using those proceeds that ultimately end up in people’s pockets. Work projects, paying teachers, good old fashioned subsidies, those are all in that same bucket. Even taxing profits or capital can fall into this bucket too, because you are taxing an investors drive to find good deals, or a founder from innovating. Again, one person vs another in terms of their “ability”. This is why this debate is poisonous. We look around and see the state of the world, see problems, and think we need to solve them by finding someone to take from, finding the person who isn’t contributing their fair share. And yet, we all are competing against technology (in a sense, see footnote 3) and right now we have so little redistribution from technology to us. I wish I had more concrete numbers here, to show just how small a share of government tax->spend is from technology to us (as opposed to us->us, the majority case), I’m trying to work on that part, but it’s hard due to the nature of the problem. Probably I need a DSGE. Ok now I’m rambling, thanks for reading though. EDIT: I didn’t need a DSGE. Check it out: Working on Economics with Fable 5 – Wilsons Blog↩︎