I’ve come to realise that the true implications of my piece here and the more rigorous version here aren’t quite as clear as I would have hoped, so this piece serves to make that a bit more obvious.
The thesis in the other two pieces, which I recommend reading since I won’t do any justifying here that isn’t already done there, is that through textbook market distortion we have systematically misallocated the productive hours of all people. Before you say “but without that labor, we would not have had the development and growth that we have!”, go read the other pieces, and consider that the core, efficient use of labor would not have been lost. What is lost is the make-work hours that is, in economic terms, misallocated. Calculating how much can be done by calculating how many hours were spent to raise output above a certain level for a given year.

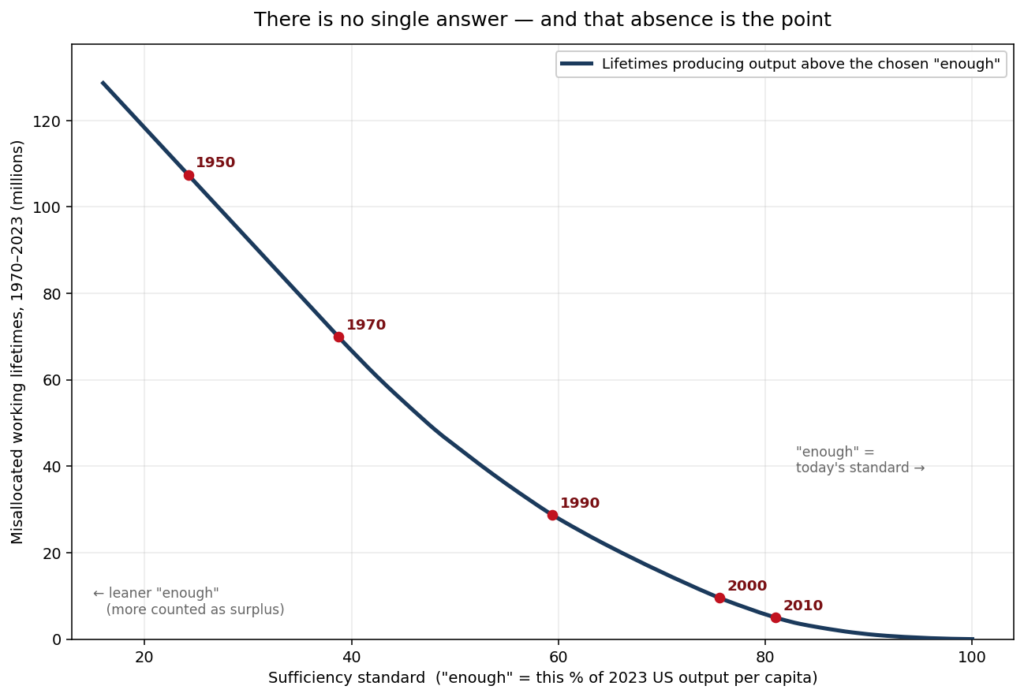
Figure 1: US working lifetimes spent producing output above a chosen “sufficiency standard,” 1970–2023. Each point on the curve answers: if “enough” is fixed at the real output-per-capita level s, how many full working lifetimes of US labor went into producing the aggregate output above that level between 1970 and 2023?1
What the thesis implies: We have not been allowed to choose a point on this curve. I don’t mean that we should have collectively chosen one, it’s just that each individual has been denied the right to choose any point on this graph beyond the current, 2026 point.
People cannot simply choose to take more leisure time because the ability to take leisure is still conditioned almost entirely on labor. To take time off, you have to save up. To save up, you have to work. Labor is distorting the real value of leisure if the production of that leisure needs less labor due to automation (leisure time still requires production so you can be fed, housed, and more if you go on holiday, travel, or consume to keep yourself entertained or educated).
And if you are wondering “If I choose 1990, do we lose the internet?” or “If I choose 1970, wouldn’t the economy collapse?” the answer is almost certainly not. To the first question, research still happens through R&D and universities, technology still would progress. To the second question, the economy is incredibly adaptable, if work needs doing, even with a base rate of consumption, it will raise wages until working is attractive. The system has not been allowed to function as it should.
I cannot tell you how many lifetimes of labor went misallocated exactly. To know that requires collecting the aggregate data from all people about where they believe they should be on this curve, in terms of what their labor is worth versus what they want to consume (in terms of consuming both goods and leisure). That is exactly what the economy is meant to do, to find that aggregate. Right now, it cannot. However, the answer is obviously in the millions of lifetimes.
Millions of lifetimes spent, for what?
Millions of lifetimes that, had labor been able, would most likely have been put into leisure. Do not forget, leisure means taking care of parents, of kids, of meeting friends in third spaces. All these things we wondered how we managed to lose. This distortion has been the largest calamity of the modern era.
This is a shorter piece. The full justification, evidence from data, and the solution, is here, please read it. I may very well be wrong, which to be honest would be comforting to feel right about now. If you have good responses to the original piece, please contact me at “wilson(at)wilsoniumite.com”
Footnotes:
- Formally, with one working lifetime defined as W = 72,000 h (40 full-time years × 1,800 h/yr)
L(s) = (1/W) · Σ₍ₜ₌₁₉₇₀₎^₂₀₂₃ Hₚᵥ(t)·N(t)·max(1 − s/y(t), 0)
where Hₚᵥ(t) = per-worker annual hours, N(t) = persons employed, y(t) = real output per capita, and s = a fixed real output-per-capita level. Total hours worked in year t are Hₚᵥ(t)·N(t); the factor max(1 − s/y(t), 0) is the share of that year’s output exceeding the per-capita standard s, so years before the economy reaches s (and recession dips below it) contribute zero. The x-axis expresses s as a percentage of 2023 output per capita, s/y(2023)·100; the curve is evaluated on a 500-point grid from 0.16·y(2023) to y(2023). Red markers sit at s = y(T) for the calendar benchmarks T ∈ {1950, 1970, 1990, 2000, 2010}, i.e. “hold the year-T standard of living” (values: 107.4, 69.9, 28.7, 9.5, 5.0 million lifetimes respectively; the 2020 standard gives 1.1M). ↩︎